Number of traders net-short has increased by 38.39% from last week.SYMBOLTRADING BIASNET-LONG%NET-SHORT%CHANGE IN LONGSCHANGE IN SHORTSCHANGE IN OIFT
Number of traders net-short has increased by 38.39% from last week.
| SYMBOL | TRADING BIAS | NET-LONG% | NET-SHORT% | CHANGE IN LONGS | CHANGE IN SHORTS | CHANGE IN OI |
|---|---|---|---|---|---|---|
| FTSE 100 | BULLISH | 49.12% | 50.88% |
-2.41% Daily -25.60% Weekly |
19.32% Daily 38.39% Weekly |
7.56% Daily -2.71% Weekly |
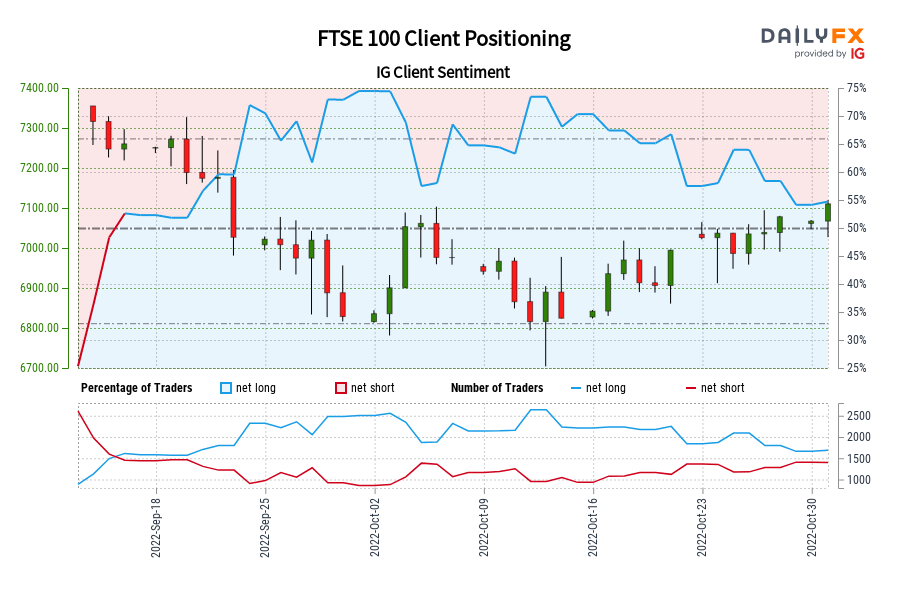
FTSE 100: Retail trader data shows 49.12% of traders are net-long with the ratio of traders short to long at 1.04 to 1. In fact, traders have remained net-short since Sep 16 when FTSE 100 traded near 7,260.30, price has moved 2.06% lower since then. The number of traders net-long is 2.41% lower than yesterday and 25.60% lower from last week, while the number of traders net-short is 19.32% higher than yesterday and 38.39% higher from last week.
We typically take a contrarian view to crowd sentiment, and the fact traders are net-short suggests FTSE 100 prices may continue to rise.
Our data shows traders are now net-short FTSE 100 for the first time since Sep 16, 2022 when FTSE 100 traded near 7,260.30. Traders are further net-short than yesterday and last week, and the combination of current sentiment and recent changes gives us a stronger FTSE 100-bullish contrarian trading bias.
element inside the
element. This is probably not what you meant to do!Load your application’s JavaScript bundle inside the element instead.
www.dailyfx.com