
A weaker dollar typically makes gold more affordable for international buyers, and this correlation played a significant role in Monday’s rebound.
Analysts, however, remain cautious about the metal’s next move. “Gold prices are due for a slight recovery following recent hefty sell-offs, and we may expect some drift higher with a rollover in the dollar,” said IG strategist Yeap Jun Rong.
Gold’s future remains tied to U.S. interest rate policy. Elevated interest rates reduce the appeal of non-yielding assets like bullion. As seven Federal Reserve officials prepare to speak this week, traders are seeking clarity on whether strong economic data could postpone potential rate cuts.
Fed Officials’ Outlook Shapes Gold’s Path
The Federal Reserve’s monetary policy stance continues to dominate market sentiment. Strong U.S. retail sales data for October reinforced the view that the economy remains resilient. Markets are increasingly pricing in the likelihood of steady rates, with less-dovish comments from policymakers expected in December.
This recalibration poses both opportunities and risks for gold prices. If markets remain underprepared for the Fed’s hawkish tone, gold could face renewed pressure. “Less-dovish rhetoric could pose an obstacle for gold, as the Fed sets the stage for a potential rate hold in January,” noted analysts.
However, geopolitical developments, including the Biden administration’s decision to allow Ukraine to use U.S.-made weapons against Russia, have also introduced a layer of uncertainty. Any escalation in the Ukraine-Russia conflict could support gold as a safe-haven asset.
Gold (XAU/USD) Technical Outlook – November 18, 2024
Gold prices ($2,589.38) gained 1.02% in today’s session, rebounding from key support near $2,538.03, marking a pivotal zone for short-term sentiment.
The asset remains within a broader ascending channel, but recent pullbacks suggest caution as the price approaches the 50-day EMA ($2,645.68). The RSI (48.33) signals neutral momentum, indicating consolidation before a potential directional move.
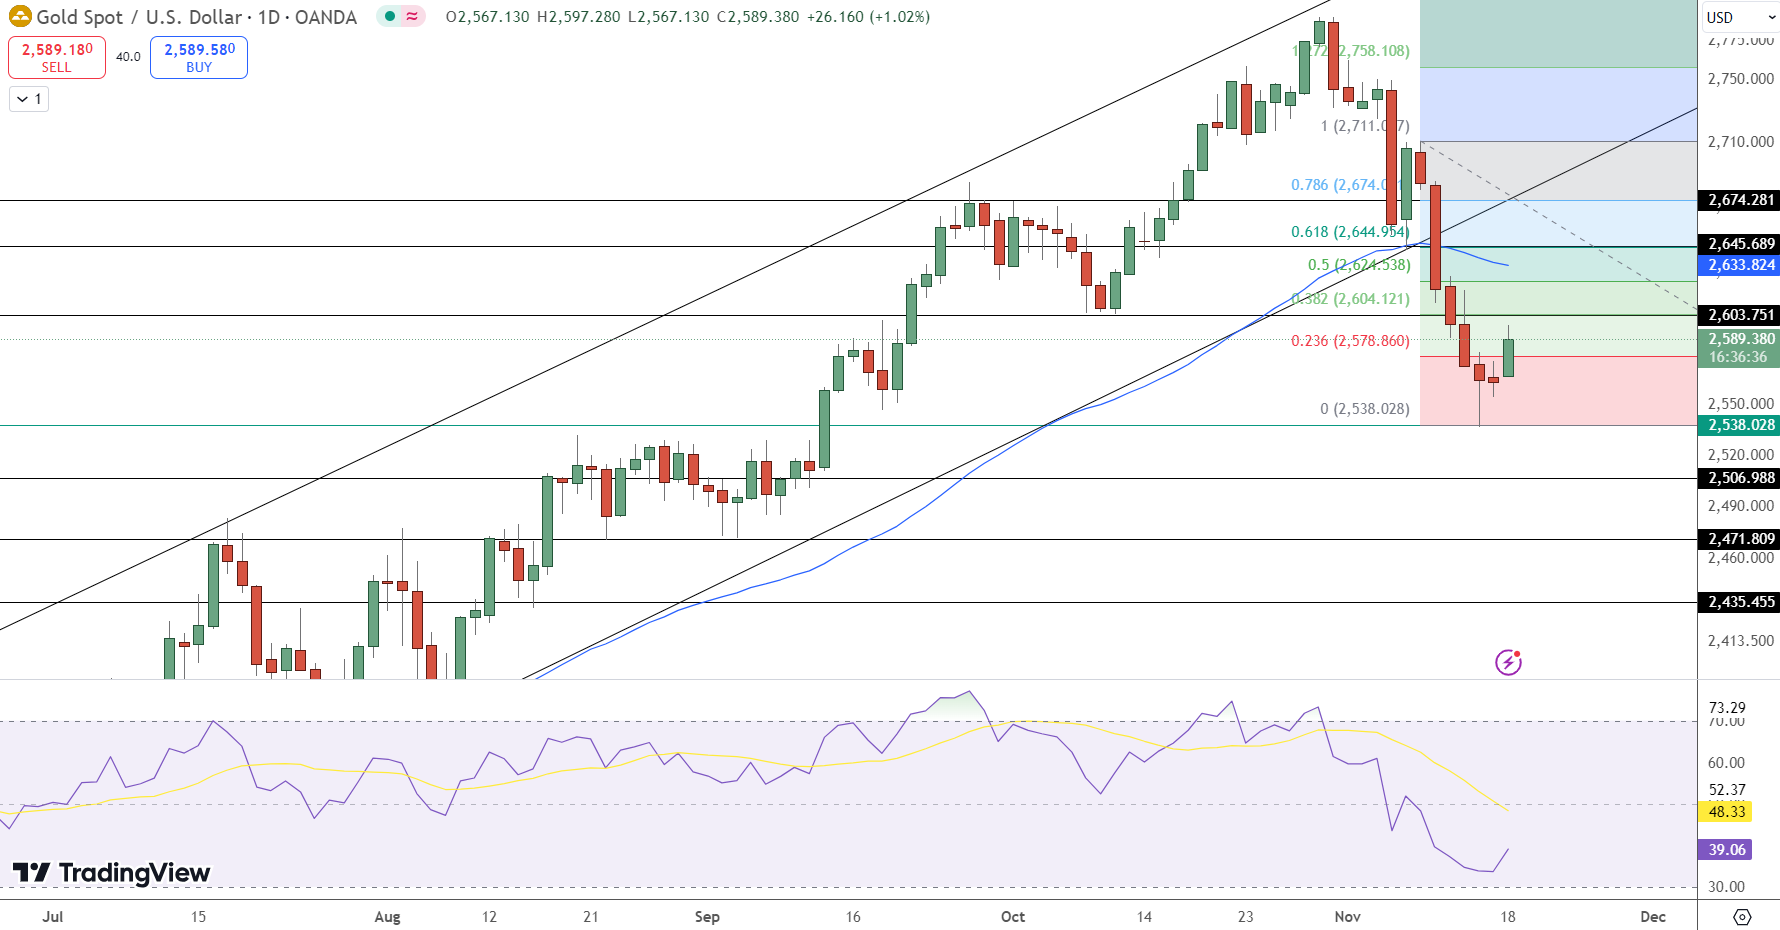
Immediate resistance is at $2,604.12 (Fibonacci 38.2% retracement), followed by $2,644.95 (61.8% level) and $2,758.10. Support holds firm at $2,538.03, with the next levels at $2,506.98 and $2,435.46.
Bulls require sustained momentum above the 50-day EMA to challenge higher levels, while a break below $2,538 could signal a deeper correction toward $2,471.80. Investors should monitor global economic updates and central bank rhetoric for directional cues.
www.fxleaders.com