

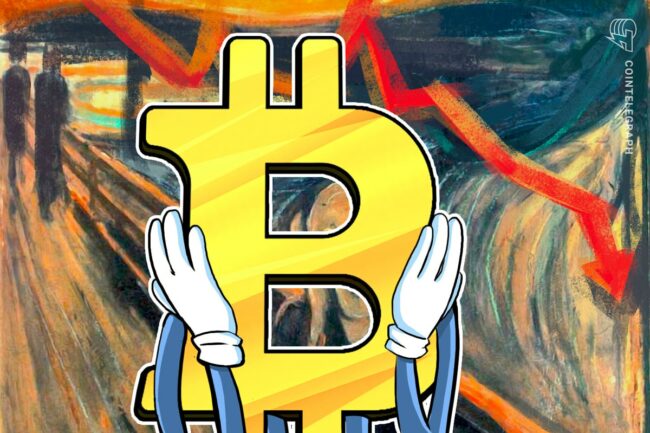
Bitcoin (BTC) starts the second week of March at a bearish crossroads as new multimonth lows get closer.
-
Traders and analysts agree that little stands in the way of a $78,000 retest as BTC/USD seals its worst-ever weekly candle.
-
CPI and PPI are due as markets enter a broad risk-off phase and stocks’ futures tumble.
-
How low can Bitcoin go? $69,000 old all-time highs from 2021 are back on the menu.
-
Sentiment is on the floor, and not just in crypto — but not everyone believes that the situation on the ground is really all that bad.
-
Whales have been buying throughout the past week, indicating a solid risk-return basis at current price levels.
BTC price dives 14% in a week
Diving to $80,000 into the weekly close, Bitcoin’s latest weekly candle stands out for all the wrong reasons.
In US dollar terms, BTC/USD shed more value in seven days than at any time in history, data from Cointelegraph Markets Pro and TradingView shows.


BTC/USD 1-week chart. Source: Cointelegraph/TradingView
So far, bulls have narrowly avoided a rematch with multimonth lows from late February, but among some Bitcoin traders, the mood is predictably cautious.
“Bitcoin is back in the critical zone of the weekly parabolic trend,” popular analyst Kevin Svenson wrote in part of his latest analysis on X.
“We are still holding the current lows of last week, no new low has been created yet. This is $BTC’s last chance to maintain an exponential higher low.”

BTC/USD 1-week chart with parabolic trendline. Source: Kevin Svenson/X
Trader SuperBro meanwhile joined those preparing for a $78,000 rematch.
“Closed above the prior candle’s low and 50% level, but cracked the uptrend from Oct ’23,” part of a reaction to the weekly close stated.
“A candle like that rarely turns on a dime, so despite bullish divergences on the LTF I’m prepared for a sweep of the lows.”

BTC/USD 1-week chart. Source: SuperBro/X
Others sought more data to confirm a truly bearish breakdown.
“Are we in a bear market now? Simply no. There isn’t enough confluence to confirm that at all,” popular trader CrypNuevo argued in a dedicated X thread.
Even for him, however, new lows were on the cards, with the area around $77,000 particularly important.
“We can see some liquidations exactly at $77k in HTF, although they are not as reliable as LTF liquidations,” he continued.

BTC order book liquidity data. Source: CrypNuevo/X
CPI week overshadowed by market nerves
This week’s key US macroeconomic data releases are not in short supply, but markets are already flipping to an increasingly “risk-off” stance.
The February print of the Consumer Price Index (CPI) and Producer Price Index (PPI) are both due, along with the familiar job openings and jobless claims figures.
Both CPI and PPI overshot the mark last month amid an inflation rebound, which shook mark confidence.
Since then, neither crypto nor stocks have succeeded in recovering, and with the next Federal Reserve interest rates decision coming next week, there is little sign of optimism.
The latest data from CME Group’s FedWatch Tool puts the odds of a cut on March 19 at just 3%. Meanwhile, the Fed’s May meeting is seeing rate-cut odds rapidly decrease.

Fed target rate probability comparison. Source: CME Group
“Amid all the trade war chaos, we have seen economic growth expectations crash sharply,” trading resource The Kobeissi Letter wrote in part of its latest X analysis.
“The Atlanta Fed reduced their Q1 2025 GDP growth estimate to as low as -2.8% last week. As a result, we saw interest rate cut expectations move up SHARPLY last week.”
Kobeissi noted that on short timeframes, stocks were gearing up for a “red” open.
“Crypto’s decline was a clear indication of growing risk-off sentiment this weekend,” it summarized.
Back to 2021 for BTC price?
When it comes to BTC price bottom targets, the landscape is looking ever more nerve-racking for bulls.
With $80,000 hanging in the balance, one classic forecasting tool suggests that a reliable floor may only lie at Bitcoin’s old all-time high — not from last year, but from 2021.
Created by network economist Timothy Peterson in 2019, Lowest Price Forward effectively delivers BTC price levels that will not be violated in the future.
In mid-2020, it correctly predicted that BTC/USD would never trade below $10,000 from September onward.
Now, the new line in the sand lies somewhere around $69,000.
“Lowest Price Forward doesn’t tell you where Bitcoin will be. It tells you where Bitcoin won’t be,” Peterson told X followers in a recent post this month.
“There is a 95% chance it won’t fall below $69k.”

Bitcoin Lowest Price Forward chart. Source: Timothy Peterson/X
Peterson’s tool is not alone in eyeing new macro lows for BTC/USD to come.
As Cointelegraph reported, calls for a trip to the mid-$70,000 range are growing, with Bitcoin’s 50-week simple moving average (SMA) a key target at $75,560.
The 200-day SMA, traditionally a bull market support line, failed as support around the…
cointelegraph.com