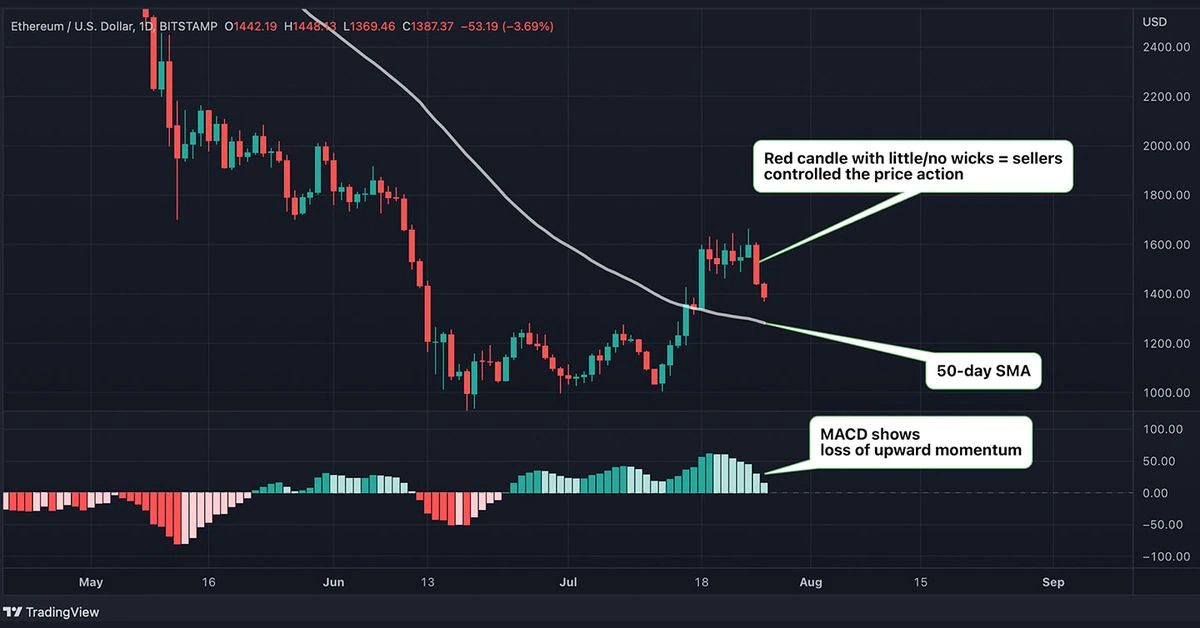
The two-day slide marks a clear breakdown of the six-day trading range of $1,460 to $1,660.Sellers appear to be in total control, as evident from the

The two-day slide marks a clear breakdown of the six-day trading range of $1,460 to $1,660.
Sellers appear to be in total control, as evident from the nearly absent lower and upper wicks in Monday’s candle and the going candle. Such candlesticks represent a bearish mood and often portend deeper declines.
The daily chart MACD histogram, an indicator used to gauge trend strength and changes, is charting smaller bars above the zero line, a sign of loss of upward momentum.
The focus, therefore, has shifted to the 50-day simple moving average at $1,293. Resistance is seen at the previous week’s high of $1,664, followed by $2,160, the interim low registered on Jan. 24.
“A pullback in Ether may find initial support at the 50-day MA (~$1,293), but we expect an eventual retest of interim support ($1,000) on the next down-leg,” Katie Stockton, founder and managing partner of Fairlead Strategies, wrote in a research note published Monday, noting short-term signs of exhaustion.
Stockton attributed the pullback from recent highs to short-term signs of exhaustion and said ether would take at least a few months to establish a major low.
The U.S. stocks were trading lower at press time, adding to renewed weakness in ether and the broader crypto market.
www.coindesk.com
