
SUMMARY
Following Wall Street’s version of a Black Friday sale, we will let price and our models/indicators tell us when/where this decline ends, while identifying support and watching the Volatility Index.
[wce_code id=192]
WALL STREET’S BLACK FRIDAY SALE
Last Monday’s Tech Talk report highlighted the domestic equity market’s weak/weakening short-term condition and consequently placed a great deal of importance on short-term support and managing risk into year-end. The support levels highlighted in the report were already violated before stocks sold off sharply across the board on Black Friday amid fears of a new COVID variant. In a half day of trading, a Small Cap proxy fell almost 3.8%, DJIA lost over 2.5%, and both the SPX and NASDAQ declined over 2%—price discounts for sure. Concurrently, Crude Oil fell over 13% and the Volatility Index (VIX/28.62) advanced 54% the same day. Over the past eleven months, spikes in the VIX like last Friday have occurred closer to the end of a decline, not the beginning. Sometimes the spike by the VIX marked the low and sometimes it was the beginning stage of developing a new bottom—Figure 1. Regardless, the Thanksgiving seasonal factor didn’t work (see paragraph below). Let’s see what occurs following the VIX spike.
Q4 2018?
An expansion occurred (again) in new 52-week lows, especially using a 5- and 10-day average (please reach out for a chart). Stocks were unable to rally last week despite historically doing well the week of Thanksgiving. Furthermore, the External Composite of the NDR Catastrophic Stop Loss Model is showing a bearish reading. I need to ask, “Does the current tape action feel similar to Q4 2018, which culminated in a sharp decline that ended 12/24/18?”
One of the canaries in the coalmine during Q4 2018 was the equity market’s inability to produce a sustainable rally despite oversold conditions. We will watch the same when/if oversold conditions occur.
Please note: The NDR Catastrophic Stop model, which remains on a fully invested signal, is based on the combination of two proprietary composites: 1) the Internal Composite (technical and price-related indicators) and 2) the External Composite (fundamental, economic, interest rate, and behavioral/sentiment indicators). Each composite is one-half of the overall score.
SUPPORT AND RESISTANCE
Figure 1: S&P 500 Large Cap Index. | Initial support exists between 4550 and 4500, followed by the middle 4400 area. Additionally, I am focused on how the SPX reacts to Friday’s spike by the VIX—please see chart.
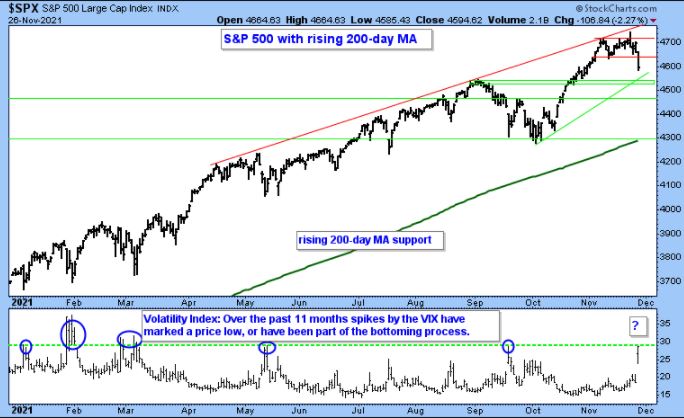
Figure 2: iShares Russell 2000 ETF (Small Cap proxy). | While closing right at gap support (short horizontal green line) I would label Friday’s close a minor victory because contrary to its Large Cap brethren, this Small Cap proxy closed well above its worst level of the day—blue circle.
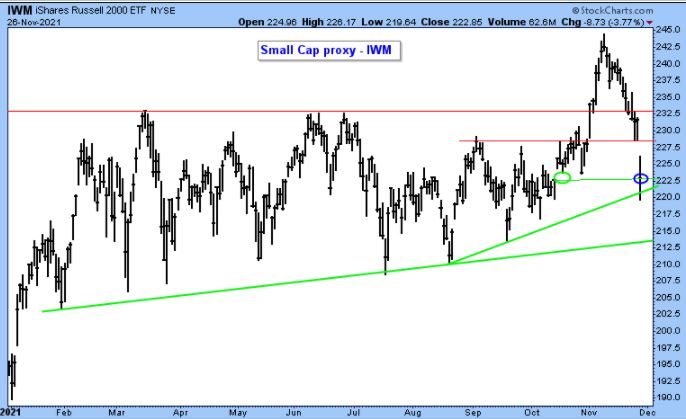
Figure 3: Dow Jones Industrial Average. | Will gap support in and around Friday’s close hold? Otherwise, a larger zone of support exists between 34,500 and 33,850+/-.
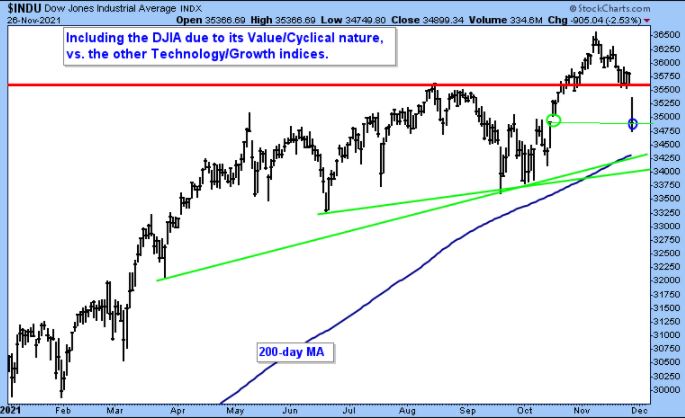
Figure 4: Dow Jones Transportation Average. | With resistance highlighted in red and support highlighted by the green box, the moment of truth has arrived.
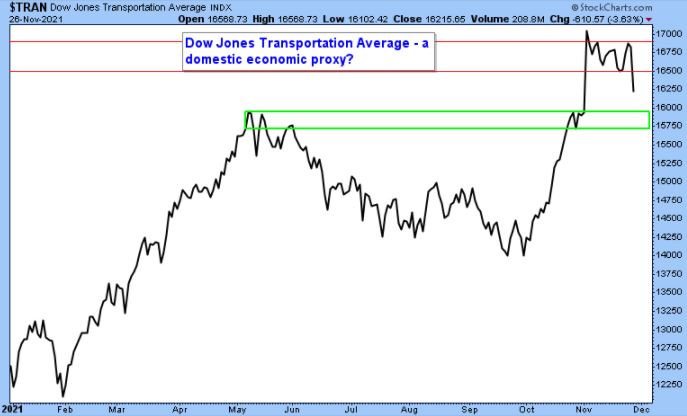
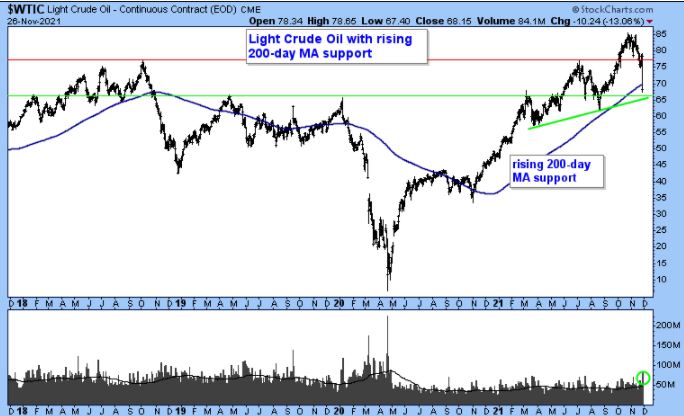
Figure 5: Light Crude Oil. | Support exists between the upper and middle $60s+/-. Considering its proximity to support (green and blue lines, upper frame), Friday’s spike in volume (green circle, lower frame) may be climactic, which is a positive development.
As we move into the final month of 2021, the team at Day Hagan Asset Management thanks you for your interest in our research and investment strategies. If you have any feedback, please reach out and let us know how we can improve our research reports, investment strategy updates, and online events to help your investment, trading, and risk management discipline in 2022.
Art Huprich, CMT®
Chief Market Technician
Day Hagan Asset Management
—Written 11.28.2021. Credit for report title: Carl and Erin Swenlin. Chart and table source: Stockcharts.com unless otherwise noted.
UPCOMING EVENTS
Day Hagan Market Update with Donald Hagan, CFA, on December 8, 2021, at 4:15 p.m. ET.
Day Hagan Technical Analysis with Art Huprich, CMT, on December 14, 2021, at 4:15 p.m. ET.
Day Hagan/Ned Davis Research Smart Sector® with Catastrophic Stop with Art Day, on December 9, 2021, at 1:15 p.m. ET.
Day Hagan/Ned Davis Research Smart Sector® with Catastrophic Stop with Art Day, on December 9, 2021, at 1:15 p.m. ET.
Originally published by Day Hagan on November 29, 2021.
For more news, information, and strategy, visit the ETF Strategist Channel.
Disclosure: The data and analysis contained herein are provided “as is” and without warranty of any kind, either express or implied. Day Hagan Asset Management (DHAM), any of its affiliates or employees, or any third-party data provider, shall not have any liability for any loss sustained by anyone who has relied on the information contained in any Day Hagan Asset Management literature or marketing materials. All opinions expressed herein are subject to change without notice, and you should always obtain current information and perform due diligence before investing. DHAM accounts that DHAM or its affiliated companies manage, or their respective shareholders, directors, officers and/or employees, may have long or short positions in the securities discussed herein and may purchase or sell such securities without notice. The securities mentioned in this document may not be eligible for sale in some states or countries, nor be suitable for all types of investors; their value and income they produce may fluctuate and/or be adversely affected by exchange rates, interest rates or other factors.
Investment advisory services offered through Donald L. Hagan, LLC, a SEC registered investment advisory firm. Accounts held at Raymond James and Associates, Inc. (member NYSE, SIPC) and Charles Schwab & Co., Inc. (member FINRA, SIPC). Day Hagan Asset Management is a dba of Donald L. Hagan, LLC.
Read more on ETFtrends.com.
The views and opinions expressed herein are the views and opinions of the author and do not necessarily reflect those of Nasdaq, Inc.
www.nasdaq.com