
US Dollar (DXY) Price, Chart, and AnalysisThe US dollar is printing a steady series of short-term higher highs.US T-bill yields balloon higher. R
US Dollar (DXY) Price, Chart, and Analysis
- The US dollar is printing a steady series of short-term higher highs.
- US T-bill yields balloon higher.
Recommended by Nick Cawley
Get Your Free USD Forecast
The ongoing impasse in the US debt ceiling negotiations remains the driving force behind the US dollar, as US short-dated debt yields continue to soar. The one-month US T bill is offered with a 6%+ yield to maturity, a fresh multi-decade high, while even shorter down the curve, T-bills maturing just after the June 1st potential default date was seen trading with a yield in excess of 7%. These unheard-of yields are giving the US dollar a strong push higher as the short-term rate differential between other G7 currencies widens.
Debt Ceiling Blues, Part 79. What Happens if the US Defaults?
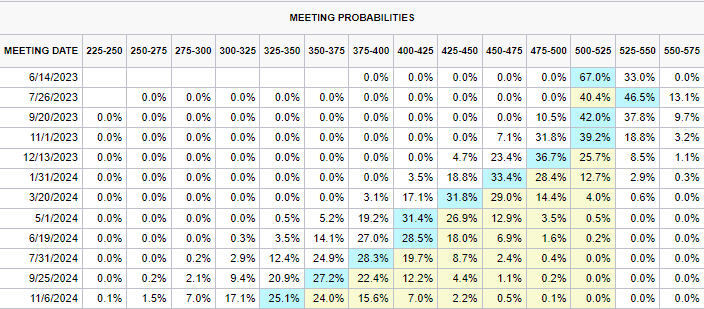
Staying with the US bond market, the re-pricing of interest rate hikes continues as market expectations of another 25bp rate hike at the June 14 meeting build. According to CME Fed Fund probabilities, there is now a 33% chance of a rate hike in June with this probability rising to 46.5% at the July meeting. The rate-sensitive UST 2-year is now offered with a multi-week high yield of 4.42%, nearly one full percentage higher than the March 24th low. The first Fed rate cut is now only just priced-in for the December meeting. It seems the market is now listening to the US central bank about rates remaining at their current levels, or slightly higher, for longer after months of ignoring the Fed’s market guidance.
Trade Smarter – Sign up for the DailyFX Newsletter
Receive timely and compelling market commentary from the DailyFX team
Subscribe to Newsletter
On Friday, the latest US Core PCE report hits the screens at 12:30 GMT (13:30 UK) along with Durable Goods Orders for April. Ninety minutes later the latest Michigan Consumer Sentiment data is released. Both of these events have the ability to fuel volatility as the long weekend nears.
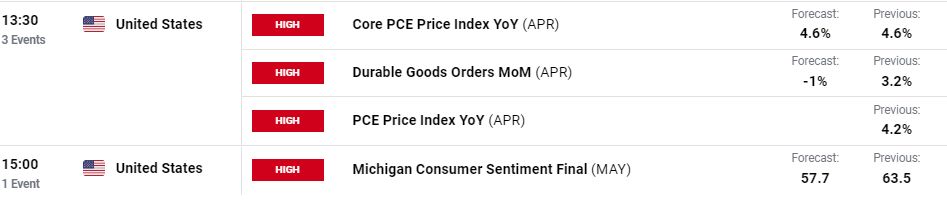
For all market-moving data releases and economic events see the real-time DailyFX calendar
The greenback is now close to a zone of prior support and resistance between 104.30 and 105.36. The US dollar is likely to be held back by this zone, and the 200-day sma just above, and may retrace slightly, all things being equal. Volatility remains low in the US dollar, using the ATR at the bottom of the chart, while the CCI indicator shows the greenback in overbought territory. Calm before next week’s debt ceiling D-day?
US Dollar (DXY) Daily Price Chart – May 25, 2023
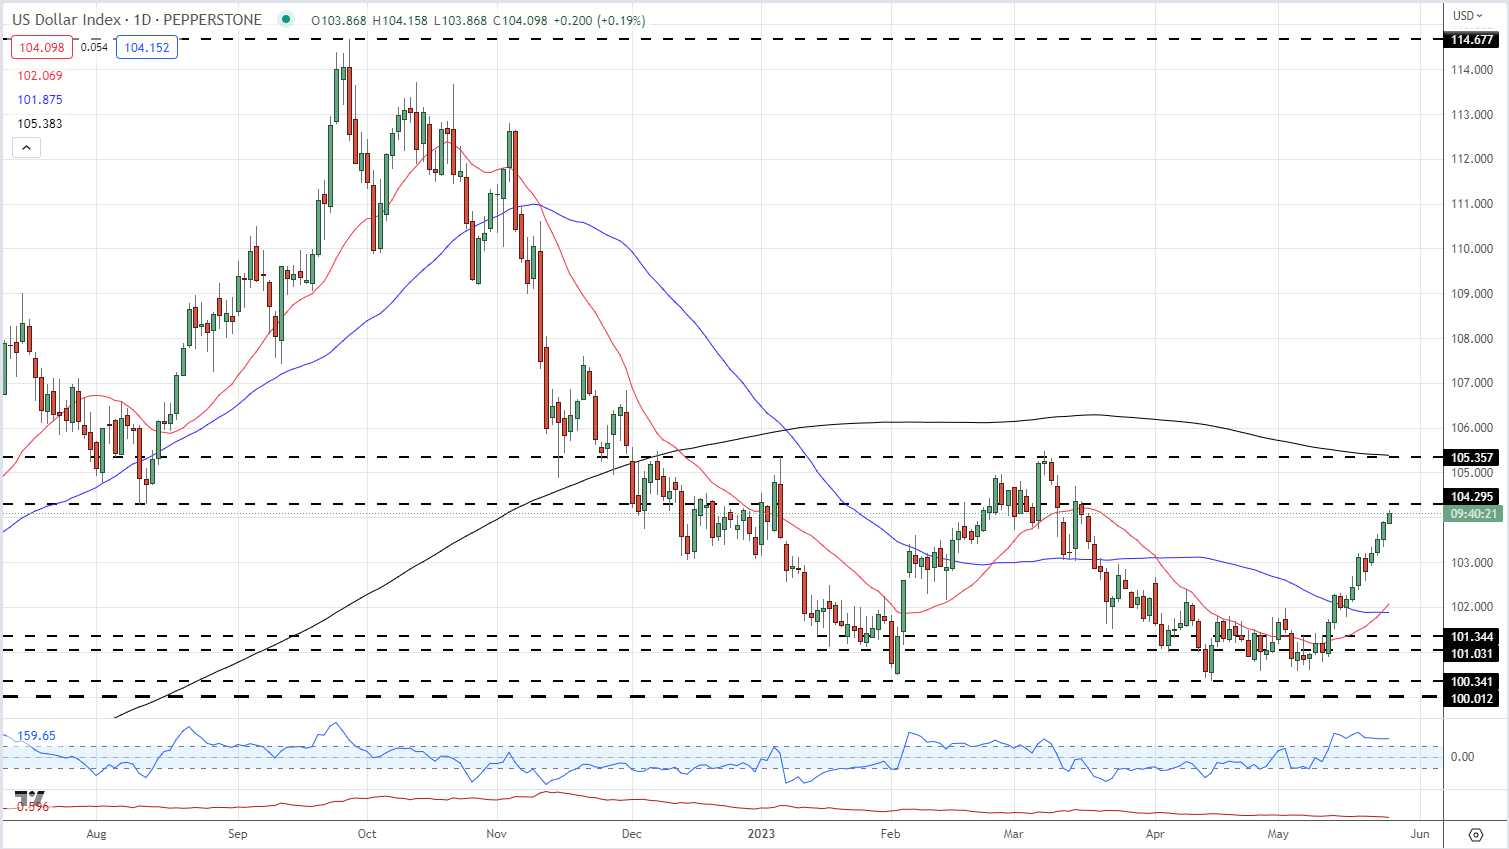
Chart via TradingView
What is your view on the US Dollar – bullish or bearish?? You can let us know via the form at the end of this piece or you can contact the author via Twitter @nickcawley1.
element inside the
element. This is probably not what you meant to do!Load your application’s JavaScript bundle inside the element instead.
www.dailyfx.com