
EUR/JPY Price and Chart AnalysisThe long-term trend remains in force.ECB policy decision on Thursday is now key.The daily, weekly, and monthly EUR/JP
EUR/JPY Price and Chart Analysis
- The long-term trend remains in force.
- ECB policy decision on Thursday is now key.
The daily, weekly, and monthly EUR/JPY charts continue to paint a bullish picture for the pair, despite multiple overbought signals flashing a warning. As with all strong moves, traders may be wise to wait for a period of consolidation before entering a trade – as other traders take profits – but strong trends should be capitalized on.
The Japanese Yen remains under pressure due to a confluence of factors. The Bank of Japan (BoJ) today said that monetary tightening is not ‘suitable’ despite annualized core inflation hitting 2.1% in April. BoJ governor Kuroda believes this rise to be temporary and that the central bank will continue to keep monetary policy loose for longer to allow the economy room to grow. In addition to the economic problems wrought by covid, Japan is a major importer of oil and with prices in the commodity space continuing to surge, the Japanese economy needs all the help that the central bank can provide.
While the BoJ continues to lean on loose monetary policies, the European Central Bank (ECB) is looking to tighten the monetary screws. While a rate hike, from a current level of -0.50% – is not expected to be announced at this week’s policy meeting, financial markets have already priced in a series of 25 basis point increases through the rest of the year. Some market commentators have even mooted the idea of 50 basis point hikes as the ECB struggles to control runaway inflation. Higher interest rates will continue to boost the Euro’s attraction.
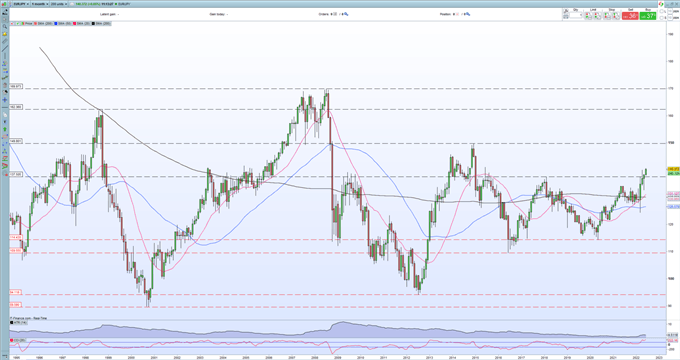
The monthly chart shows the strength of the EUR/JPY rally. The confirmed break above the February 2018 high at 137.05 has allowed the pair to break above the round number 140.00 level with little in the way of technical resistance before 149.80 comes into play, although this may take some time to achieve. The move is supported by a series of higher lows, last month’s bullish continuation hammer candle, and the 20-day sma/200-day sma crossover. The CCI indicator is flashing an overbought signal so some consolidation may occur before the next leg higher.
Hammer Candlestick Patterns: A Trader’s Guide
EUR/JPY Monthly Price Chart – June 6, 2022
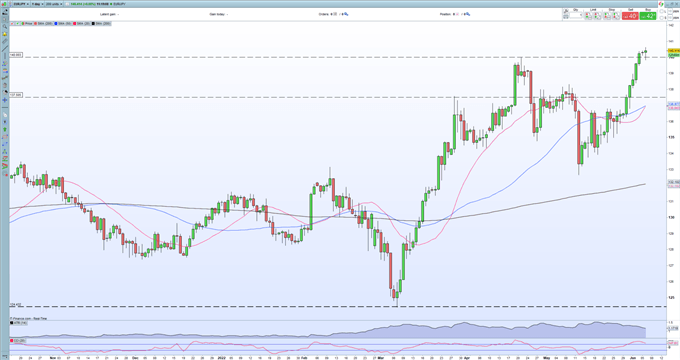
The daily EUR/JPY chart is now supported by all three simple moving averages and the creation of a new higher high last Friday. As seen on the monthly chart, there is little overhead technical resistance of note.
EUR/JPY Daily Price Chart – June 6, 2022
What is your view on the Japanese Yen – bullish or bearish?? You can let us know via the form at the end of this piece or you can contact the author via Twitter @nickcawley1.
element inside the
element. This is probably not what you meant to do!Load your application’s JavaScript bundle inside the element instead.
www.dailyfx.com