


Near-term Technical Outlook: Trade Setups on Gold, USD/JPY & SPX500
- Updated Charts on Technical Setups we’ve been tracking in Gold, USD/JPY & SPX500
- Gold weekly opening-range setup in play
- USD/JPY rally extending into key resistance- risk for inflection
- S&P 500 plunge targeting key uptrend support
An update on technical setups we’ve been tracking inthe Gold, the Japanese Yen, and the S&P 500. These are the targets and invalidation levels that matter heading into the close of the week.Review my latest Strategy Webinar for an in-depth breakdown of thesetechnical setups and more.
Gold Price Chart – XAU/USD 120min
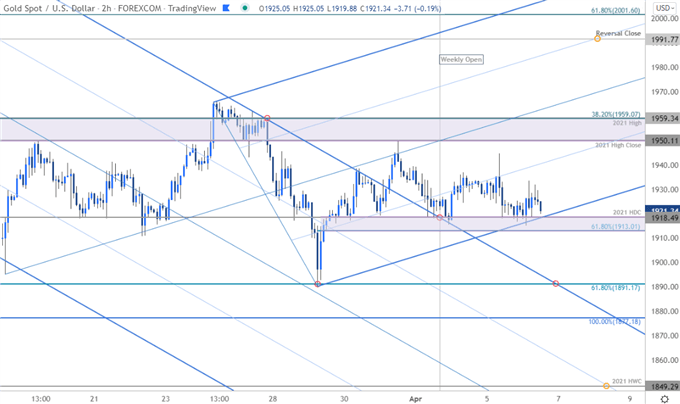

Chart Prepared by Michael Boutros, Technical Strategist; Gold on Tradingview
In this week’s Gold Price Outlook we highlighted this slope while noting that, “the focus is on a breakout of the weekly opening-range in the days ahead.” The weekly range has taken shape just above key support targets at 61.8% retracement of the late-March rally / 2021 high-day close at 1913/18– weakness below this threshold would threaten another run at the March lows near 1891. Ultimately a topside breach / close above 1950/59 is still needed to suggest a larger recovery is underway.
Bottom line: Pullbacks should be limited to 1913 IF price is heading higher on this stretch. Review my latest Gold Weekly Price Outlook for a closer look at the longer-term XAU/USD technical trade levels.
Japanese Yen Price Chart – USD/JPY 120min
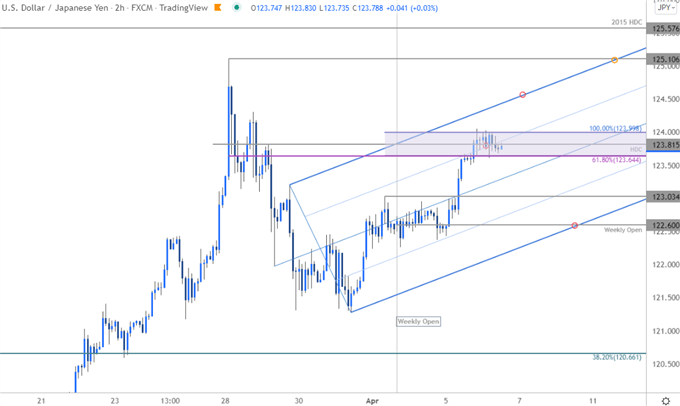

Chart Prepared by Michael Boutros, Technical Strategist; USD/CAD on Tradingview
In las month’s Japanese Yen Weekly Technical Price Outlook we noted to that the, “USD/JPY breakout is extending into key resistance at multi-year highs and while the broader outlook remains constructive, the immediate advance may be vulnerable in the weeks ahead.” Well, that idea was short-lived with USD/JPY rallying more than 2.3% off the March 31st low. A breakout of the weekly opening-range has now extended into a major technical confluence at 123.64-124 – a region defined by the 61.8% Fibonacci retracement, the yearly high-day close and the 100% extension of the most recent advance. Looking for a reaction here with a topside breach / daily close above needed to keep the immediate recovery viable. Initial support now
Bottom line: A good area to reduce portions of long-exposure / raise protective stop – losses should be limited to the weekly open at 122.60 IF price is heading higher with a breach from here exposing the upper parallel (currently ~124.50s) and the yearly high at 125.10.
S&P 500 Price Chart – SPX500 240min
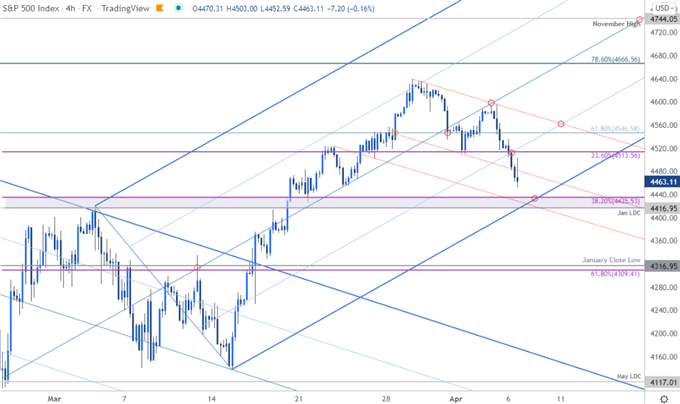
Chart Prepared by Michael Boutros, Technical Strategist; SPX500 on Tradingview
I highlighted this setup in today’s S&P 500 Technical Outlook and the levels remain in play as price eyes near-term confluent uptrend support at the January low-day close / 38.2% retracement at 4416/35.
Bottom line: We’re looking for a possible exhaustion low into / ahead of this threshold with a breach above the highlighted trendline confluence near 4560s needed to mark resumption of the broader uptrend. Review my latest S&P 500 Weekly Technical Forecast for a closer look at the longer-term SPX 500 technical trade levels.
For a complete breakdown of Michael’s trading strategy, review his Foundations of Technical Analysis series on Building a Trading Strategy
-Written by Michael Boutros, Technical Strategist with DailyFX
Follow Michael on Twitter @MBForex
element inside the
element. This is probably not what you meant to do!Load your application’s JavaScript bundle inside the element instead.
www.dailyfx.com