


NZD/USD threatens the yearly low (0.6061) after failing to test the June high (0.6576), and the exchange rate appears to be tracking the negative slope in the 50-Day SMA (0.6225) amid the string of failed attempts to push back above the moving average.
In turn, NZD/USD may trade to fresh yearly lows going into the first full week of September as it carves a series of lower highs and lows, and a move below 30 in the Relative Strength Index (RSI) may push the exchange rate towards the May 2020 low (0.5921) as the bearish momentum gathers pace.
NZD/USD Rate Daily Chart
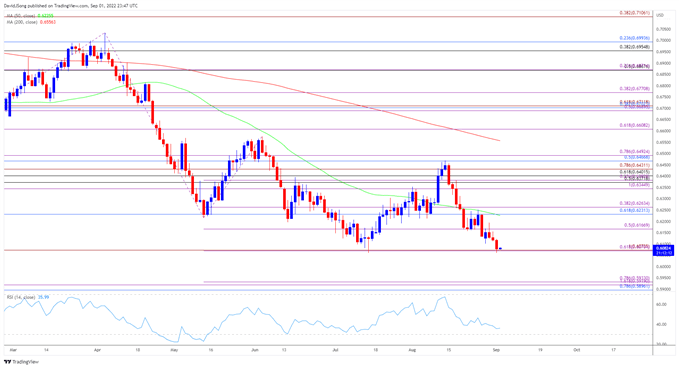

Source: Trading View
NZD/USD threatens the July low (0.6061) after failing to push back above the 50-Day SMA (0.6225), with a close below the 0.6070 (61.8% expansion) region opening up the Fibonacci overlap around 0.5900 (78.6% retracement) to 0.5930 (78.6% expansion), which lines up with the May 2020 low (0.5921).
A further decline in NZD/USD may keep pushing the Relative Strength Index (RSI) towards oversold territory, with a move below 30 in the oscillator likely to fuel the weakness in the exchange rate like the price action from earlier this year.
Next area of interest comes in around the April 2020 low (0.5843), but lack of momentum to close below the 0.6070 (61.8% expansion) region may push NZD/USD back towards 0.6170 (50% expansion) to largerly mirror the price action seen in July.
— Written by David Song, Currency Strategist
Follow me on Twitter at @DavidJSong
element inside the
element. This is probably not what you meant to do!Load your application’s JavaScript bundle inside the element instead.
www.dailyfx.com