
WTI PRICE, CHARTS AND ANALYSIS:Concerns Around the Chinese Economy Continues to Weigh on Sentiment Despite.Wedge Breakout and Death Cross (4H Chart)
WTI PRICE, CHARTS AND ANALYSIS:
- Concerns Around the Chinese Economy Continues to Weigh on Sentiment Despite.
- Wedge Breakout and Death Cross (4H Chart) Hint at Further Downside.
- Retracement Needed for Bullish Continuation Setups to Come into Play.
- The Analysis in this Article Makes use of Chart Patterns and Key Support and Resistance Levels. For More Information Visit our Comprehensive Education Library.
Get Your Free OIL Forecast Down Below
Recommended by Zain Vawda
Get Your Free Oil Forecast
READ MORE: Gold (XAU/USD) Flirts with $1900 Support as Fed Minutes Loom
WTI OUTLOOK
WTI prices had been consolidating for a prolonged period following the announcement by Saudi Arabia on continuing production cuts. The initial rally saw WTI prices reach November 2022 highs before stalling on concerns around the global recovery.
GDP data from parts of the developed world have however continued to surprise. Whether this could in part be down to a busy summer period of travel and increased demand remains to be seen.
The Chinese picture has seen fears resurface around the recovery from the world’s second largest economy. This may be misplaced however given recent data which showed Chinese demand for oil at record highs as they look to increase their stockpiles as well.
Given the position of OPEC and the Saudi cuts the outlook for the rest of Q3 and part of Q4 remain largely positive for Oil prices. A short -term correction however does appear appealing particularly from a technical standpoint.
For more Info on How Trade the Wedge Pattern and Breakouts in General Get Your Free Guide Below
Recommended by Zain Vawda
The Fundamentals of Breakout Trading
TECHNICAL OUTLOOK AND POTENTIAL SETUPS
WTI Daily Chart – August 16, 2023
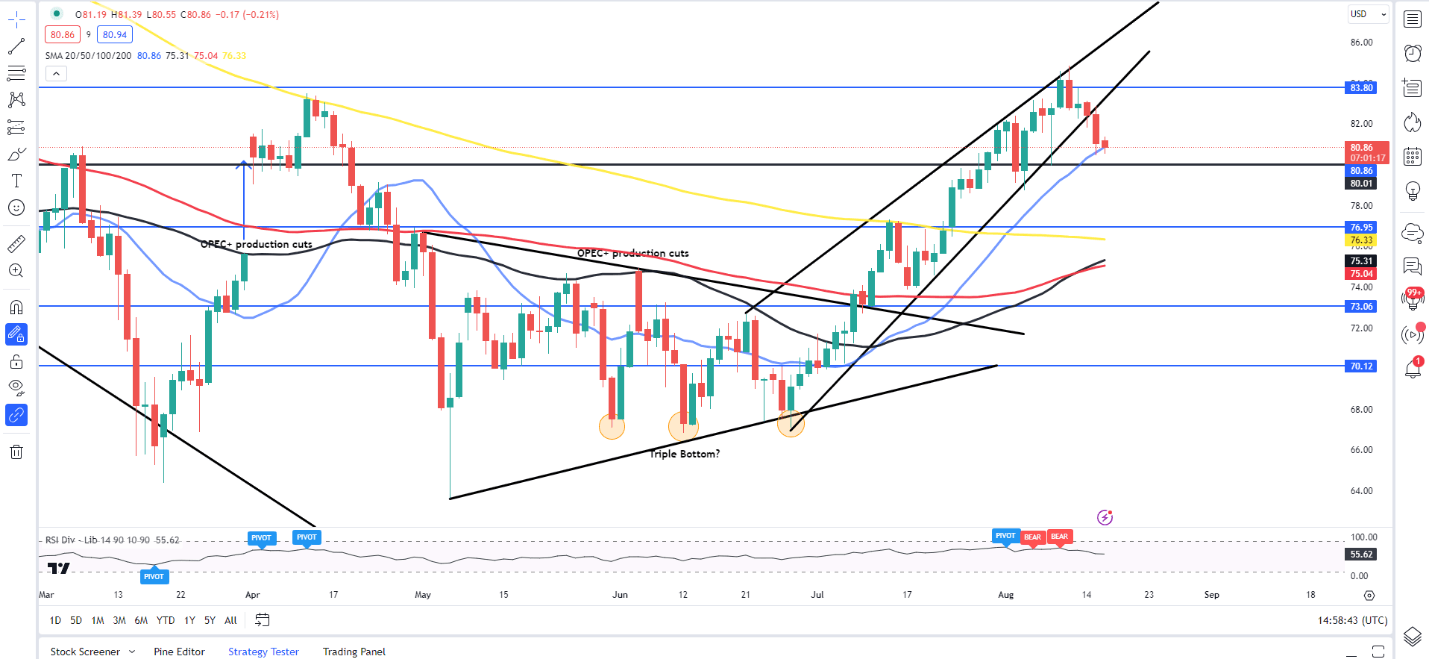
Source: TradingView
On the daily chart we can see the break below the edge pattern yesterday stalling around the 80.50 mark before a bounce of the 20-day MA. Since the range breakout around the 75.00 mark WTI has been on an aggressive push higher with very little pullback.
The selloff from the high print around 84.85 to yesterday’s lows however is quite a significant drop which should not be scoffed at. The 50-day MA has crossed above the 100-day MA and remain my only concern around a move below the psychological 80.00 mark.
WTI Four-Hour Chart– June 15, 2023
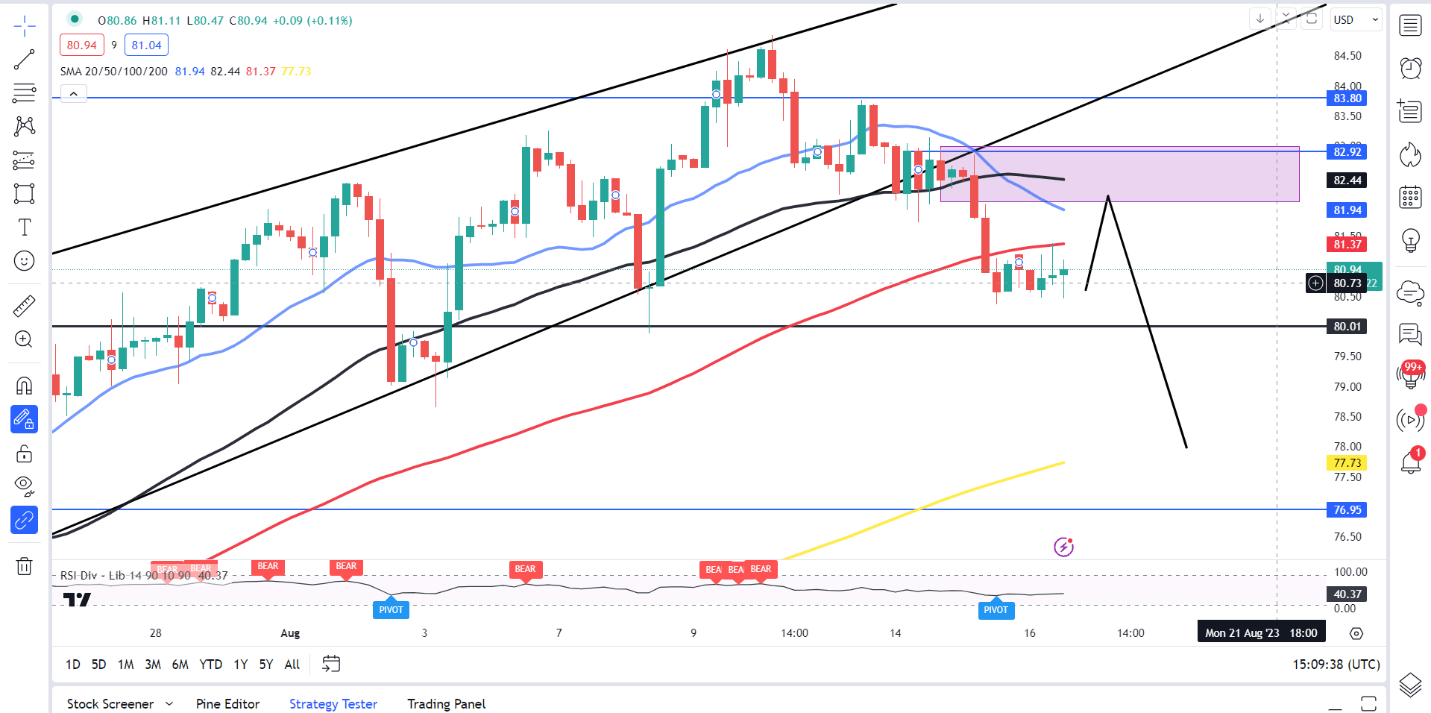
Source: TradingView
Given the comments above I would prefer some form of retracement before a potential short entry for a better risk to reward. Looking at the four-hour chart above and here we have a death cross in direct contrast to the golden cross pattern on the Daily timeframe.
Now ideally, I would like a pullback to the resistance area around the 82.00-83.00 mark which would provide a better risk-to -reward opportunity for potential shorts. The downside prospects on WTI remain juice with targets all the way down at 77.75 (200-day MA) and 77.00.
A daily candle close above the 83.00 mark would invalidate the bearish setup and will force me to reevaluate WTI moving forward.
Key resistance levels:
- 81.37 (100-day MA
- 81.93
- 82.44
Key support levels:
- 80.50
- 80.00 (psychological level)
- 77.75 (200-day MA)
IG Client Sentiment Data Shows Retails Traders are Currently 55% net short.
For a Full and Comprehensive Breakdown on Client Sentiment Data Download the Guide Below.
| Change in | Longs | Shorts | OI |
| Daily | 3% | 0% | 2% |
| Weekly | 8% | -5% | 5% |
Written by: Zain Vawda, Market Writer for DailyFX.com
Contact and follow Zain on Twitter: @zvawda
element inside the
element. This is probably not what you meant to do!Load your application’s JavaScript bundle inside the element instead.
www.dailyfx.com