
Silver – Bullish Technical Patterns on the Daily ChartThe technical outlook for silver is turning increasingly positive and suggests that the recent
Silver – Bullish Technical Patterns on the Daily Chart
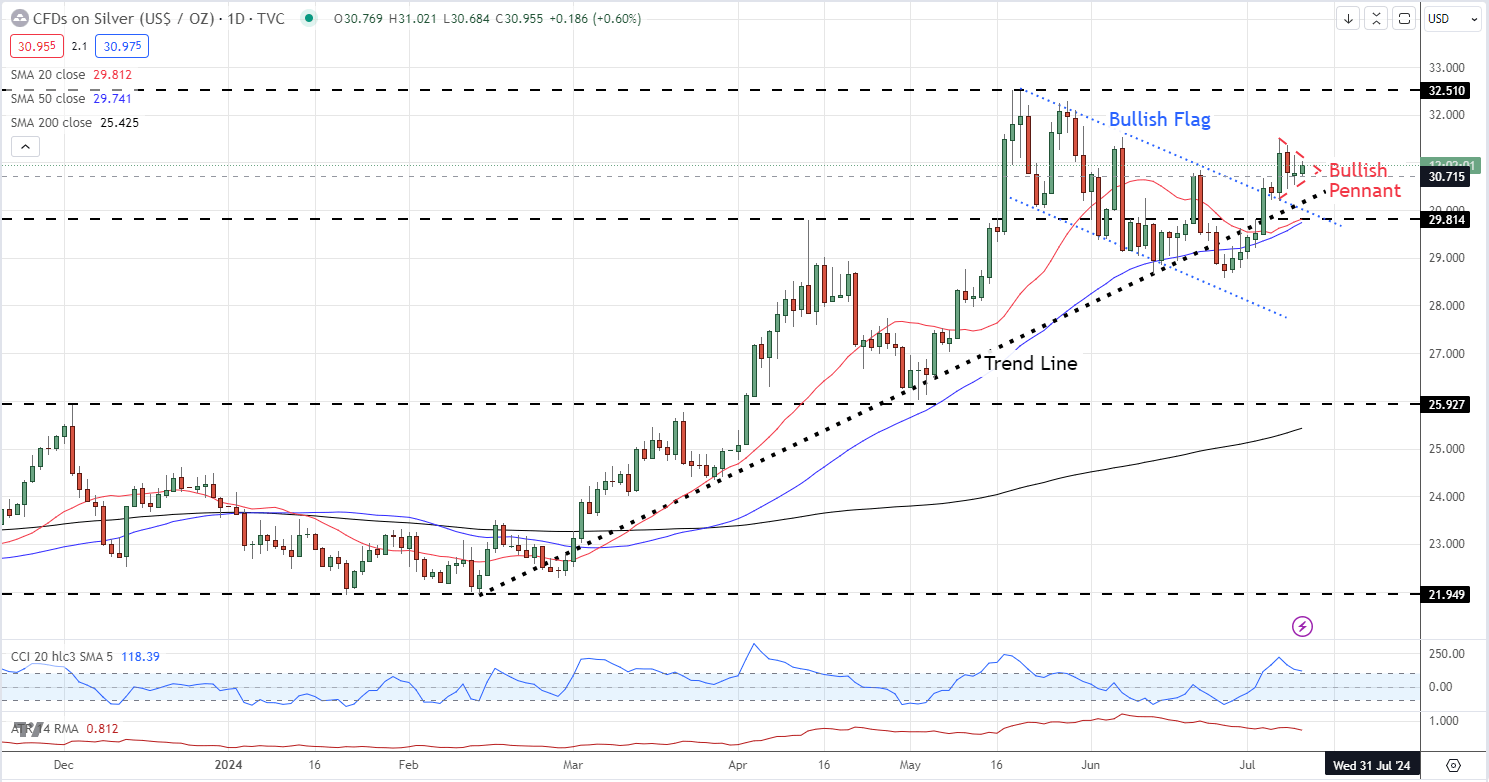
The technical outlook for silver is turning increasingly positive and suggests that the recent $32.50/oz. multi-year high will soon come under pressure. A longer-term bullish trend, combined with a medium-term bullish flag and a short-term bullish pennant makes a compelling, technical, case for higher prices in the coming weeks.
The daily silver chart shows three, distinct, bullish set-ups that suggest that XAU/USD is going higher in the coming weeks. The trendline from early February remains in place, despite the slight underperformance in late June/early July and continues to push silver higher.
Introduction to Basic Trendline Analysis
The second pattern on the chart is a Bullish Flag set-up, a continuation pattern that is seen as a pause in a trend before a secondary move higher. This pattern has already seen a break above flag resistance and suggests a further move higher.
How to Trade Bullish Flag Patterns
The latest technical pattern on the daily chart is a short-term Bullish Pennant set-up, another closely followed continuation pattern. A break higher would leave the multi-year high at $32.51/oz. vulnerable.
Pennant Patterns: Trading Bearish and Bullish Patterns
In addition to the above, all three simple moving averages remain in a positive set-up, while the CCI indicator is showing silver coming out of extreme overbought territory.
Silver Daily Price Chart
element inside the
element. This is probably not what you meant to do!Load your application’s JavaScript bundle inside the element instead.
www.dailyfx.com