
US Dollar, EUR/USD, GBP/USD, AUD/USD, USD/CAD Talking Points:It’s a big week for global markets, and next week brings the Fed, all of which can ma
US Dollar, EUR/USD, GBP/USD, AUD/USD, USD/CAD Talking Points:
It’s a big week for global markets, and next week brings the Fed, all of which can make a pensive backdrop ahead of the holidays. With that said, stocks are lifting aggressively today in stark contrast to the pain that had shown last week. Those bearish drivers seemed to stack up, with the Omicron variant getting attention around the Thanksgiving holiday. Then last Tuesday Powell moved to take ‘transitory’ out of the Fed’s verbiage in a sign seen as a win for inflation.
The Friday NFP report wasn’t all that positive either, sizably missing the headline expectation of 550k. The one side of the report that was a positive was the unemployment rate sinking down to 4.2%, which is beyond the Fed’s threshold for maximum employment at 4.5%. So, this is a factor that could denote even more hawkishness as the Fed now has inflation well-above target to go along with the maximum employment that they’ve been looking for through the year while dismissing inflation as transitory.
All of this comes home to roost next week with the December FOMC rate decision. This is a quarterly meeting so the bank will also be supplying updated forecasts and guidance. This is where we can see just how much the move away from ‘transitory’ means to the bank.
At this stage, there’s a 97.3% chance of seeing at least one hike out of the Fed next year, per CME Fedwatch. There’s also a current 84% chance of seeing more than one rate hike. The median expectation for next year is three rate hikes, which is considerably divergent from the FOMC’s recent forecast for one hike next year.
The US Dollar
The US Dollar has had a full head of steam so far in Q4. Two weeks ago the USD breakout ran-up to another key zone of resistance in an area with multiple Fibonacci retracement levels taken from longer-term studies. But, rather than elicit a pullback as those resistance levels came into play, prices started to range and that remained through last week.
At this point, the weekly chart of the USD shows two consecutive dojis, highlighting indecision. But, deductively, the fact that a deeper pullback could not show after a week of indecision highlights the continued bullish potential in the currency, especially as the Fed finds itself in the awkward position of looking to play catch-up with inflation.
Whether or not this pulls back this week is likely going to depend on just how weak other major currencies might be, and as we’ll look at in the next four markets, many major currency pairs are sitting on or driving near big long-term support structures.
Near-term, the 96.47 level remains of interest as the USD hasn’t yet been able to generate much drive beyond this price. This was the final target from the Q4 Technical Forecast (link for the full forecast is below). If a pullback does develop this week which, again, could be more motivated by longer-term support in other major fx pairs, higher-low support potential exists in the USD around the 94.50 level which had played in as resistance in the initial Q4 breakout in the US Dollar.
US Dollar Weekly Price Chart
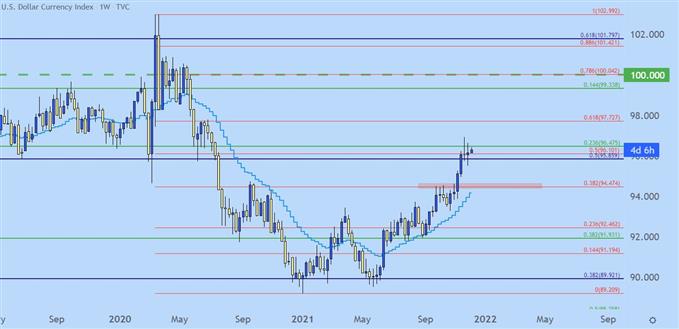
Chart prepared by James Stanley; USD, DXY on Tradingview
EUR/USD
I’ve said countless times during this recent USD breakout that if the US Dollar is going to go anywhere, it’s likely going to need at least some help from the Euro.
The Euro remains a heavy allocation of DXY at more than 57% of the currency’s quote. And that bullish breakout in the USD through the first half of Q4 was very much supported by a plummeting EUR/USD.
But that’s about the time that a really big support area came back into the equation, and it’s a zone that I’ve been using for years around the 1.1212 Fibonacci level. This is the 61.8% Fibonacci retracement of the ‘lifetime move’ in EUR/USD, taking the low from 1999 up to the 2008 high. Very nearby is another Fibonacci level of note, with the 61.8% retracement of the 2017-2018 move plotted at 1.1187.
Collectively, these prices make up a support zone that’s so far stalled the sell-off. I had warned of this scenario in late-November and, at this point, 1.1187 marks the current yearly low in the pair. Similarly, last week produced a doji in the pair after the prior week brought in that support test.
Buyers had a chance to drive this back towards 1.1400 last week and so far haven’t been able to muster the strength. This keeps the door open for a re-test of that big picture support zone. If the USD breakout is really going to run, it’s likely going to need a break of this very key spot on the chart, which seems very possible to me around the ECB in the month of December.
EUR/USD Weekly Price Chart
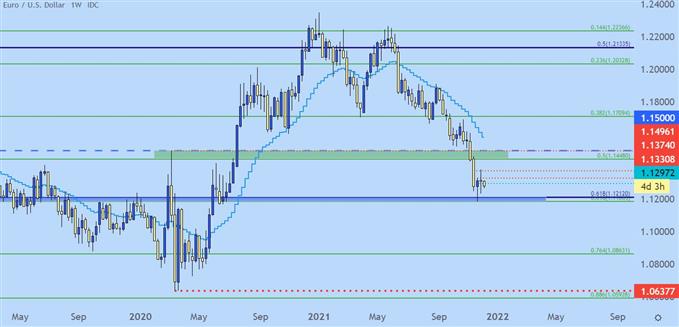
Chart prepared by James Stanley; EURUSD on Tradingview
GBP/USD
For a currency represented by a Central Bank that supposedly supposed to lift rates, the British Pound sure isn’t acting like it.
Cable has been exceedingly weak ever since the Super Thursday rate decision at the BoE in early-November. There was even odds for a rate hike going into that meeting, with GBP/USD finding equilibrium above 1.3800 ahead of that rate decision. But when the BoE didn’t hike and as factors in the US seemingly amounted to a more-hawkish FOMC, the bottom fell out of the pair and here we are about 600 pips lower.
The big level to watch here is 1.3188, which is confluent with a Fibonacci level of note around 1.3167. For reversal or even pullback scenarios, you’d want to see that level defended. If it does not hold, however, there’s risk of the bull flag formation being invalidated.
At this point the bull flag does remain in-play, but we’d need to see some bullish price action in the pair to get near and long-term vantage points aligned. For near-term resistance, I’m looking at 1.3285, 1.3326 and 1.3362, with a breach of that final level opening the door for longer-term bullish strategies.
GBP/USD Weekly Price Chart
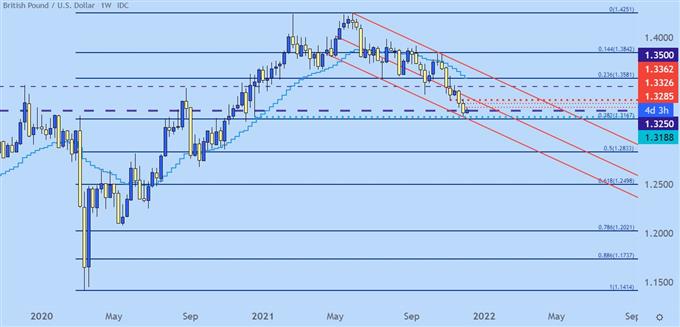
Chart prepared by James Stanley; GBPUSD on Tradingview
AUD/USD: Bear Flag Breakdown to the Big Fig
Aussie has remained bearish since early-November with the AUD/USD trend taking on a stark sense of consistency over that period of time. It’s also about 500 pips lower as there’s been only minimal pullback on the way down, as well. The bear flag has been soundly broken, at this point.
But, a major spot on the chart came into play last Friday and that’s so far leading to a bounce today. The RBA meets tonight so we’ll have a fresh driver on the matter before too long, but as shared on Friday the last time the .7000 level came into the picture, it led to a 1,000 pip incline in the pair. I’m not necessarily expecting that this time, at least not yet, but it could feed a lower-high resistance hit around the .7100 area of prior support. And if that can’t hold, another dose of resistance could be sought out around the .7200 handle.
AUD/USD Daily Price Chart
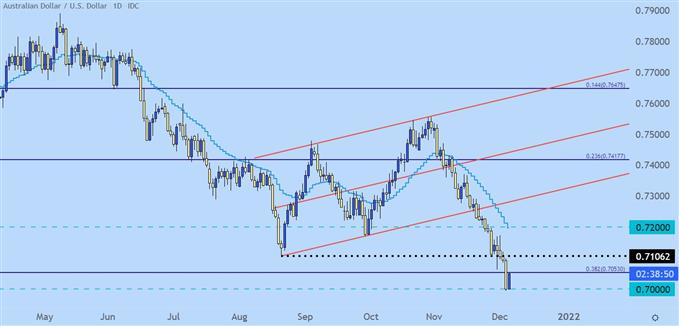
Chart prepared by James Stanley; AUDUSD on Tradingview
USD/CAD Breakout Potential
This one might need some help from oil prices if it’s going to break out, but that potential is there. As shared last week, the pair was nearing a big spot of resistance at the 1.2850 level. This is a price that, for whatever reason, has been an extremely stubborn spot of resistance. And today it’s leading to a 100+ pip pullback in USD/CAD.
This same level thwarted breakouts in August and again in September. This week brings a Bank of Canada rate decision on Wednesday, so we haven’t seen the end of volatility here as it’s shaping up to be a busy week for the pair.
Support potential remains around the 1.2750 psychological level, with a wide zone of interest a little lower, from around 1.2621-1.2672.
USD/CAD Daily Price Chart
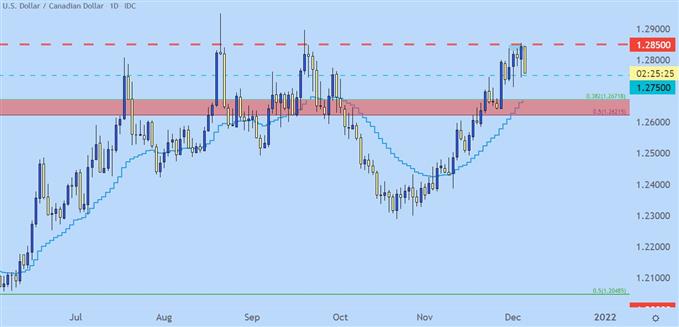
Chart prepared by James Stanley; USDCAD on Tradingview
— Written by James Stanley, Senior Strategist for DailyFX.com
Contact and follow James on Twitter: @JStanleyFX
element inside the
element. This is probably not what you meant to do!Load your application’s JavaScript bundle inside the element instead.
www.dailyfx.com