
Nasdaq, Apple Inc (AAPL) News and AnalysisApple expected to post revenue and earnings drop on reduced sales but cost cutting likely to ease concernsNa
Nasdaq, Apple Inc (AAPL) News and Analysis
- Apple expected to post revenue and earnings drop on reduced sales but cost cutting likely to ease concerns
- Nasdaq reverts to consolidation as longer-term uptrend continues. Increased volatility this week underscores the threat of possible false breakouts
- Risk events of this week: FOMC, services PMI, NFP
- The analysis in this article makes use of chart patterns and key support and resistance levels. For more information visit our comprehensive education library
Recommended by Richard Snow
See what out analysts anticipate for tech stocks in Q2
Apple Expected to Post Revenue and Earnings Drop on Reduced Sales
Apple Inc is due to release its Q2 results where it is largely anticipated that the smartphone maker will post declines on both revenue and earnings. Revenue and earnings are likely to print around 5% and 6% lower in the three months ending in March, compared to the same period last year.
However, the company is also expected to reveal a sizeable decline in expenses as the company has undergone a period of cost cutting which has thus far avoided mass layoffs. The tech sector has shed thousands of jobs after commencing a hiring spree after lockdown. In contrast, Apple did not inflate its wage bill in the same way with CEO Tim Cook taking a hefty salary cut in an attempt to cut back on costs.
Looking at the daily chart, Apple has clearly been one of the outperformers helping drag the rest of the Nasdaq higher. However, at such elevated prices, Apple would really need to wow investors if it is going to head back towards the swing high of 176.15 without a pullback towards trendline support. Support comes in at the longer-term trendline before 162.00.
Another thing to note is the appearance of negative divergence playing out on the RSI, which hints that a pullback may be on the cards.
Apple Daily Chart
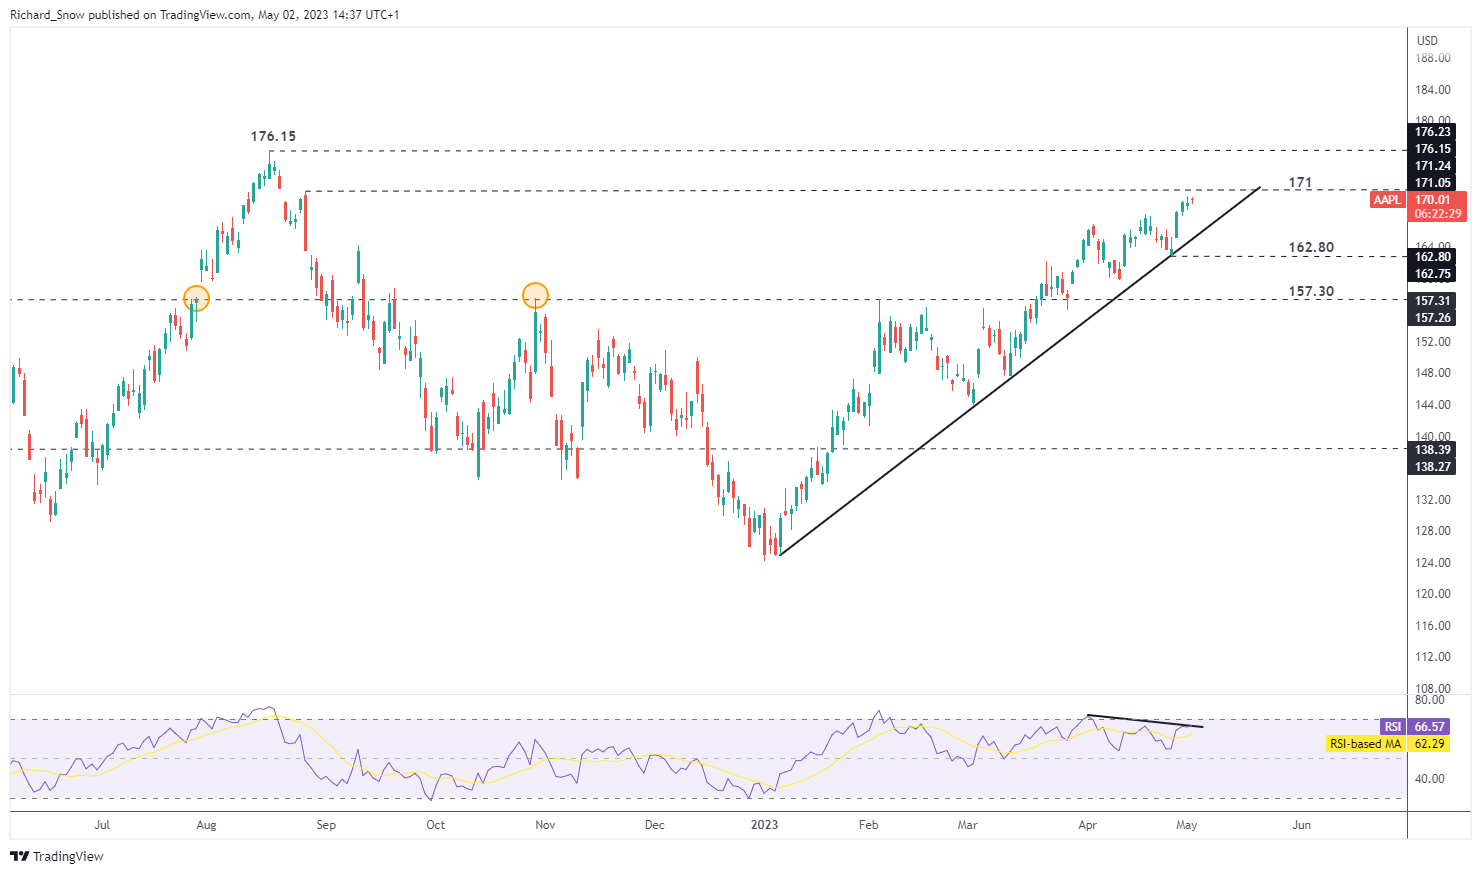
Source: TradingView, prepared by Richard Snow
Round up of Big Tech Earnings – Nasdaq Uptrend Continues
The weekly chart reveals the Nasdaq upward trend which has remained for most of 2023 with 13,74.75 the next significant move to the upside. Multiple weeks of consolidation revealing successive lower wicks suggests that the index remains rather well supported.
Nasdaq (NQ1!) Weekly Chart
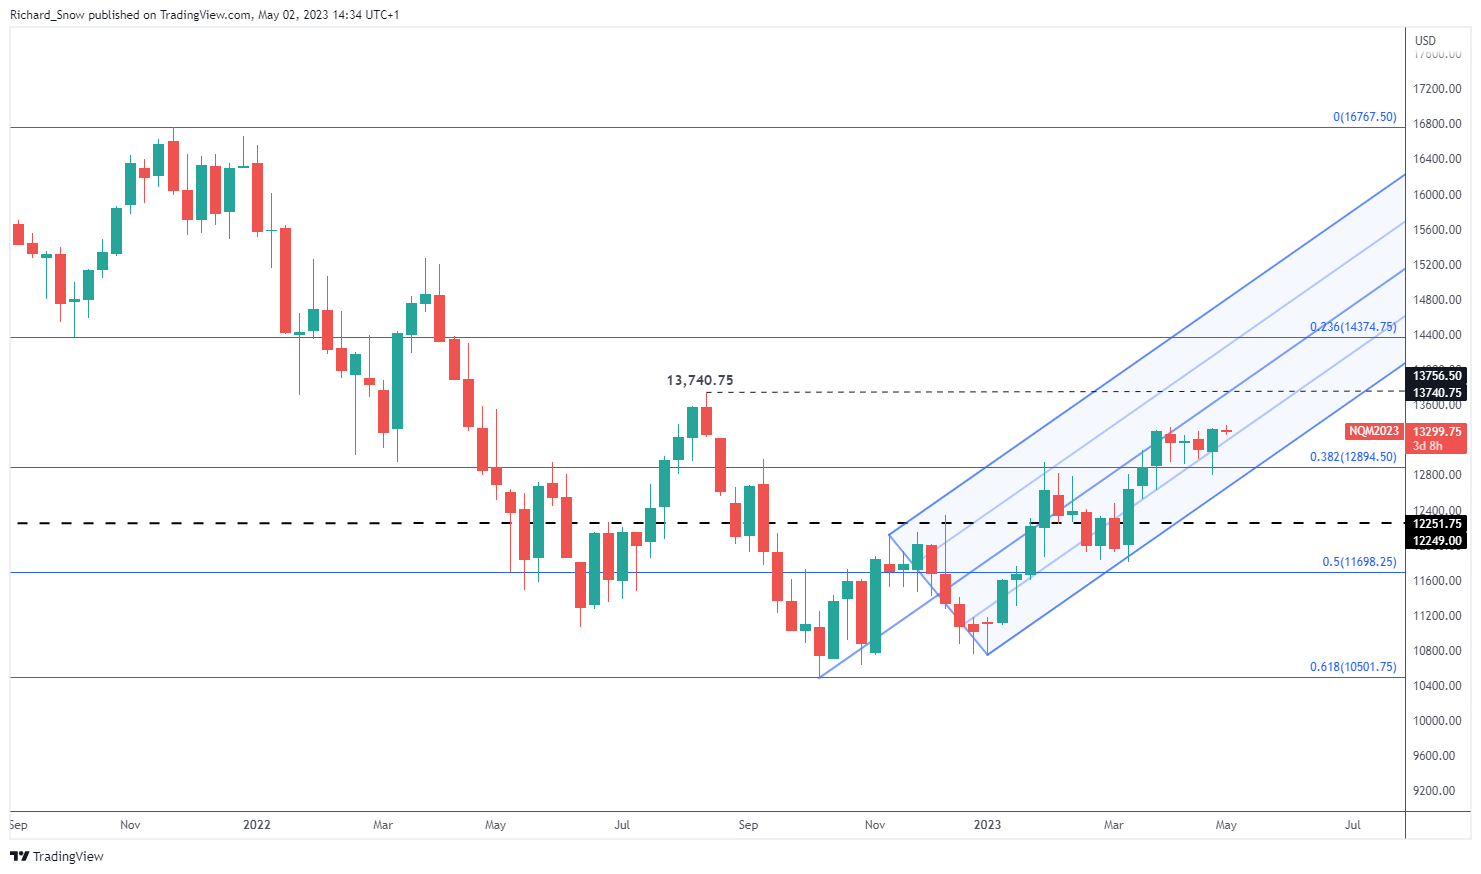
Source: TradingView, prepared by Richard Snow
The daily Nasdaq (continuous futures chart) has already highlighted the risk of false breakouts during last week’s high impact data releases. Spikes in volatility, driven by after-market earnings by First Republic Bank and US mega-caps last week, resulted in a false breakdown of the channel of consolidation as price action found its way back within the channel.
This week, with the sheer quantity of high impact data, such a scenario is possible once again. However, the FOMC has the potential to guide the next directional move given what is likely to be the last US hike before holding rates steady and markets will eagerly monitor forward guidance.
Prices test 13,350 before 13,740 comes into focus while the underside of the channel at 12,950 could come into focus on a potential hawkish FOMC event.
Nasdaq Daily Chart
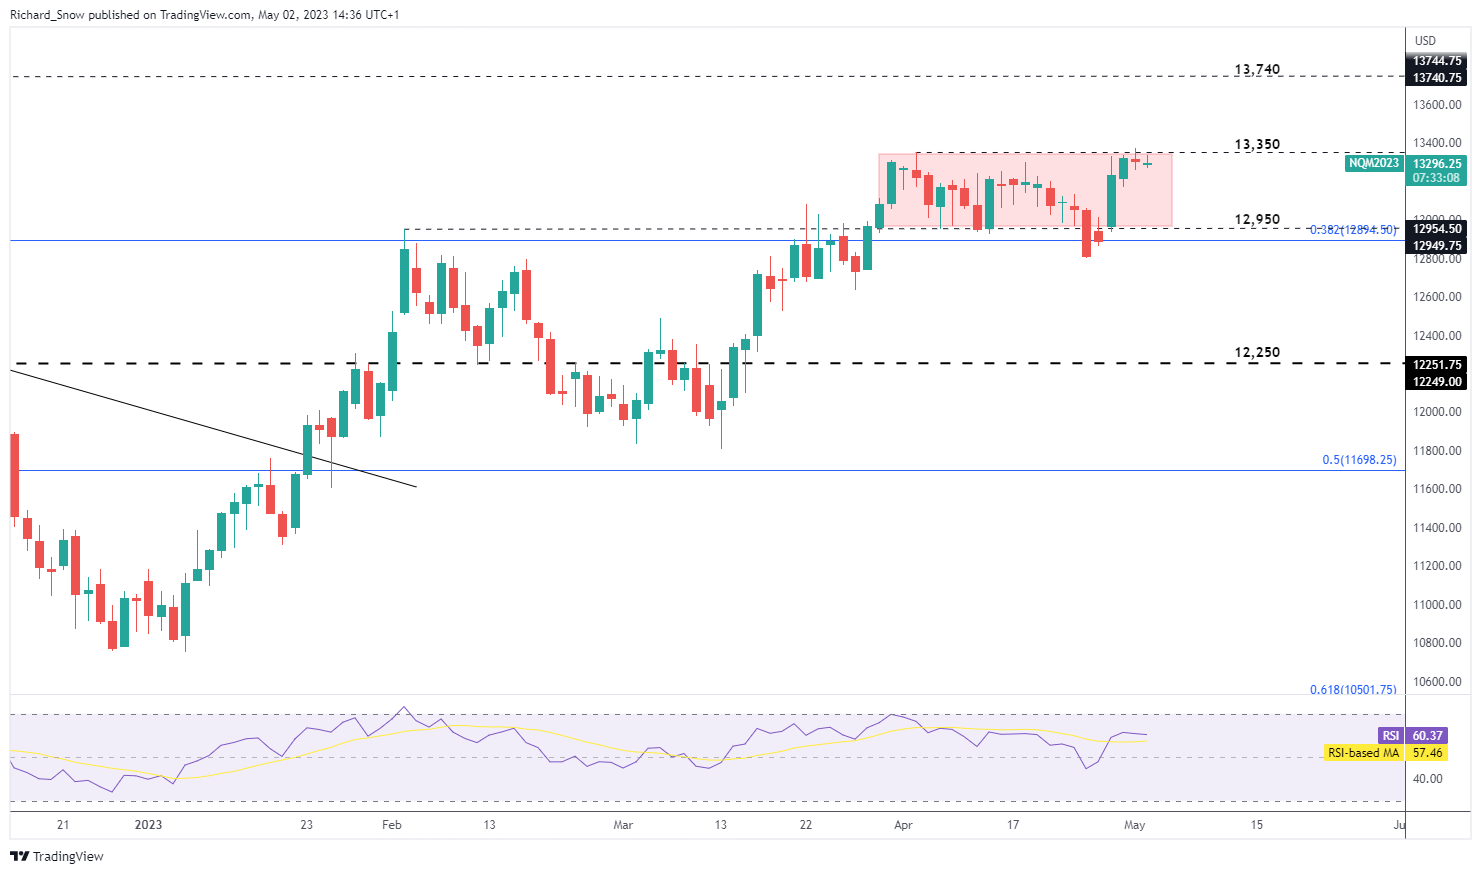
Source: TradingView, prepared by Richard Snow
Recommended by Richard Snow
Building Confidence in Trading
Major Risk Events this Week
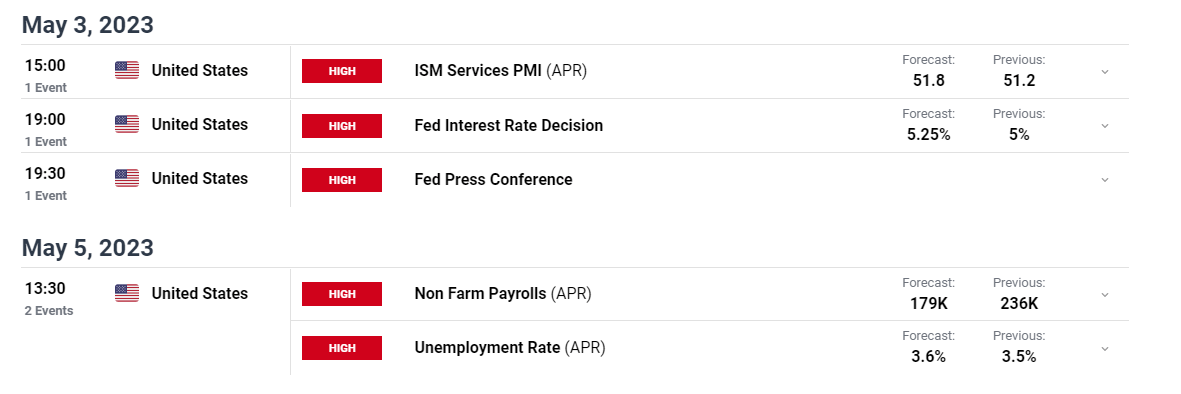
Customize and filter live economic data via our DailyFX economic calendar
Trade Smarter – Sign up for the DailyFX Newsletter
Receive timely and compelling market commentary from the DailyFX team
Subscribe to Newsletter
— Written by Richard Snow for DailyFX.com
Contact and follow Richard on Twitter: @RichardSnowFX
element inside the
element. This is probably not what you meant to do!Load your application’s JavaScript bundle inside the element instead.
www.dailyfx.com