
Technical Picture: Price Compression Signals Breakout RiskAUD/USD is compressing in a symmetrical triangle on the 2-hour chart, currently at $0.6378 j
Technical Picture: Price Compression Signals Breakout Risk
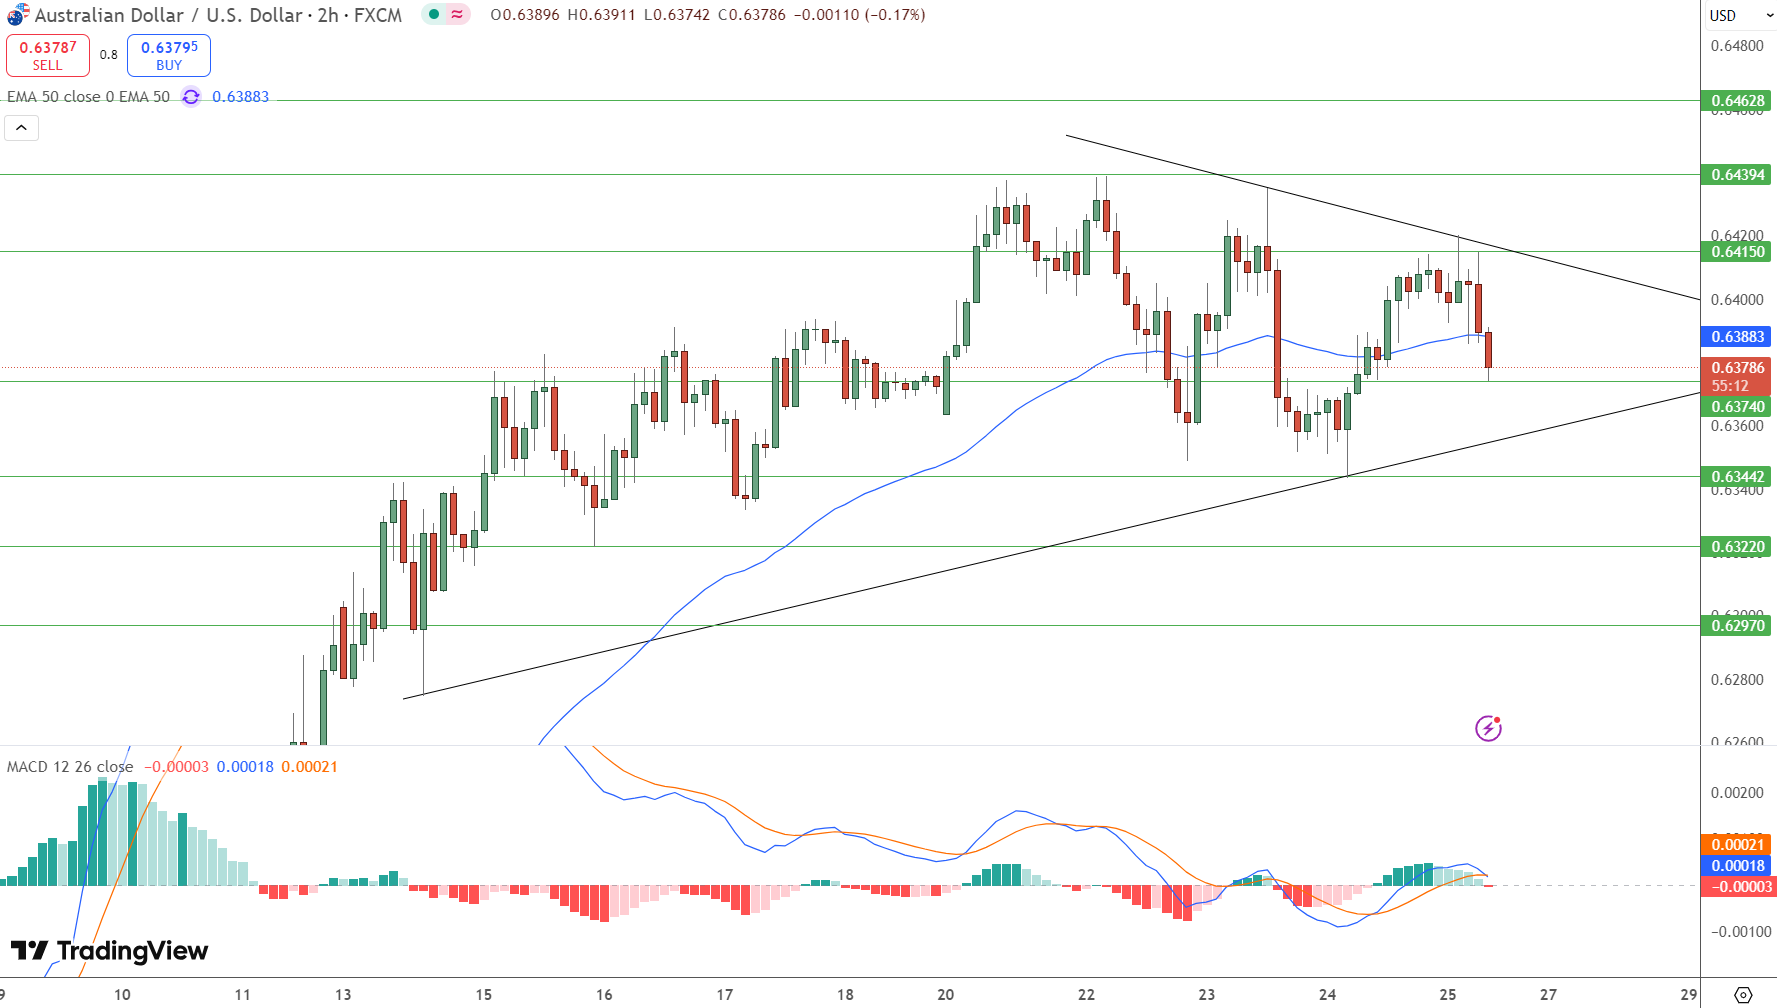
AUD/USD is compressing in a symmetrical triangle on the 2-hour chart, currently at $0.6378 just below the 50 EMA at $0.6388. The pair has failed to break above $0.6415 several times and support is holding at $0.6344.
The MACD is flattening out, suggesting momentum is fading and a breakout – up or down – may be imminent. Watch for a confirmed move outside the triangle for direction:
Trade Setup:
Be patient here. Triangles tend to compress until a clear signal emerges and chasing early moves inside the pattern can lead to whipsaws.
Macro Forces Offer Conflicting Signals
US-China trade optimism was tempered by mixed signals out of Washington. While there are hints the Trump administration may reduce some tariffs on Chinese goods, Treasury Secretary Scott Bessent quickly poured cold water on the speculation saying no formal proposals are on the table.
Meanwhile China’s Finance Ministry is calling for greater international cooperation to stabilise global markets, warning prolonged tariff friction may damage fragile economies.
In Australia, economic data has turned slightly softer. Judo Bank’s April PMIs showed:
Westpac is also expecting a 25 basis-point RBA rate cut at the May 20 meeting, suggesting the RBA sees enough slack in the economy to ease.
US Dollar Eases on Soft Labor and PMI Data
The US Dollar Index (DXY) fell to 99.60 after initial jobless claims rose to 222,000, slightly above expectations. Continuing claims dropped 37,000 to 1.841 million but the labor market is still mixed. The S&P Global Composite PMI added to the bearish tone, down to 51.2 from 53.5, indicating broad based economic slowing.
In response to market volatility, President Trump confirmed Fed Chair Jerome Powell will stay on, which is being seen as a sign of monetary policy continuity.
www.fxleaders.com