
AUD/USD ANALYSIS &TALKING POINTSMarkets turn to U.S. inflation projections for guidance.Another print lower for Australian consumer confidence tom
AUD/USD ANALYSIS &TALKING POINTS
- Markets turn to U.S. inflation projections for guidance.
- Another print lower for Australian consumer confidence tomorrow?
- 0.6900 could be under threat post-CPI.
AUSTRALIAN DOLLAR FUNDAMENTAL BACKDROP
![]()

Recommended by Warren Venketas
Get Your Free AUD Forecast
AUD/USD maintained its bullish momentum on Monday as global markets look to continue the USD selloff. The primary catalyst for this price move stems from tomorrow’s U.S. inflation release which is estimated reach 5-month lows (8.1%) on the headline read (see economic calendar below). Up to this point, there has been mostly hawkish comments from Federal Reserve officials including Fed Chair Jerome Powell last week which leads me to believe any slight inflation beat could spark a resumption of USD upside. On the contrary, a marked slowdown in inflation may see markets price in a less-aggressive Fed in the coming months.
ECONOMIC CALENDAR – WEEK AHEAD
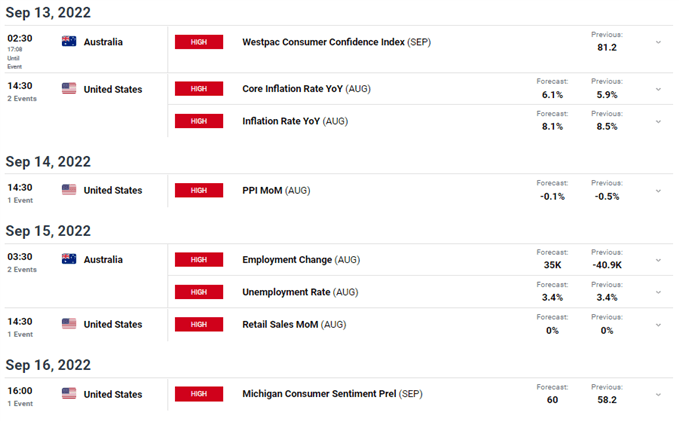
Source: DailyFX economic calendar
![]()

Recommended by Warren Venketas
Trading Forex News: The Strategy
From an Australian perspective, consumer confidence which has been on a consecutive month-month decline since November 2021 is due tomorrow, highlighting the tighter monetary policy conditions as well as demand-destruction due China’s economic woes and global recessionary fears.
In summary, the headwinds facing Australia and the AUD outweigh anything U.S. centric at this point leaving the Aussie vulnerable to further downside short-term but any potential change in risk sentiment including a turnaround in China could help bolster Aussie bets.
Foundational Trading Knowledge
Commodities Trading
Recommended by Warren Venketas
TECHNICAL ANALYSIS
AUD/USD DAILY CHART
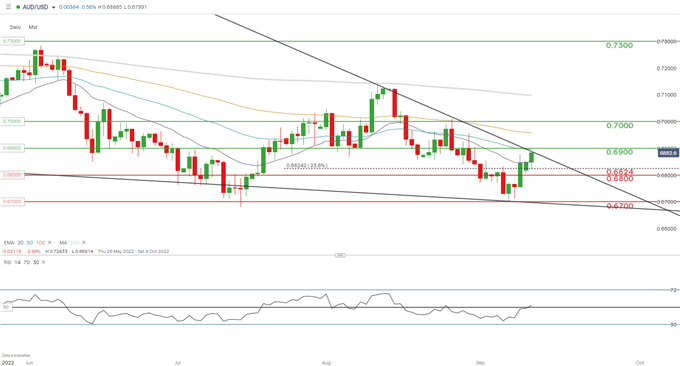
Chart prepared by Warren Venketas, IG
The psychological 0.6900 resistance zone is in focus for bulls but will be dependent on tomorrow’s CPI for now and will coincide with a trendline break (black). The Relative Strength Index (RSI) reflects this indecision with the index hovering around the 50 level.
Introduction to Technical Analysis
Technical Analysis Chart Patterns
Recommended by Warren Venketas
Key resistance levels:
- 100-day EMA (yellow)
- 0.6900/50-day EMA (blue)
Key support levels:
- 20-day EMA (purple)
- 0.6824 (23.6% Fibonacci)
- 0.6800
IG CLIENT SENTIMENT DATA: BULLISH
IGCS shows retail traders are currently LONG on AUD/USD, with 65% of traders currently holding long positions. At DailyFX we typically take a contrarian view to crowd sentiment however, due to recent changes in long and short positioning we favor a short-term upside bias.
| Change in | Longs | Shorts | OI |
| Daily | 5% | 2% | 4% |
| Weekly | -12% | 7% | -7% |
Contact and follow Warren on Twitter: @WVenketas
element inside the
element. This is probably not what you meant to do!Load your application’s JavaScript bundle inside the element instead.
www.dailyfx.com