 Breaks Major Support as Global Risk Outlook Sours")
Bitcoin (BTC) Chart and AnalysisBitcoin slumps, dragging the crypto market down with it.Global markets turn risk-off. No sooner had I posted an artic
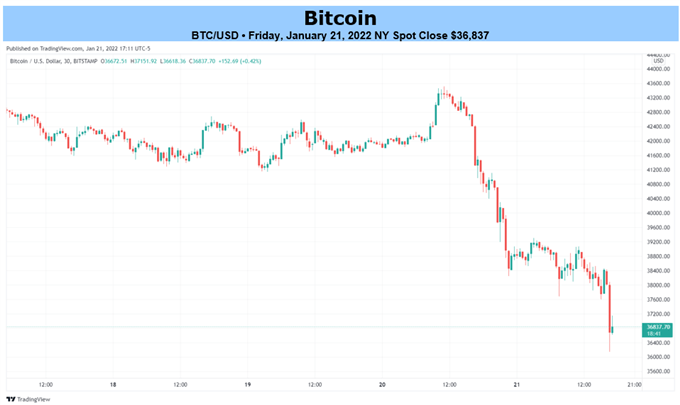
Bitcoin (BTC) Chart and Analysis
- Bitcoin slumps, dragging the crypto market down with it.
- Global markets turn risk-off.
No sooner had I posted an article highlighting the lack of Bitcoin volatility and sideways price action, than the market turned sharply lower with Bitcoin slicing through multi-month support with relative ease. The sell-off has continued today with BTCUSD touching a low of $37.7k earlier before easing back to $38.5k. Macro drivers continue to direct Bitcoin at present with the Federal Reserve looking to not only start a series of interest rate hikes imminently but to also pare back the recent monetary largesse that has fueled risk markets since Q1 2020. Markets’ expectations of a hawkish Fed meeting next week are high and this may leave room for the Fed to disappoint, especially if chair Powell factors in the recent heavy sell-off in global risk markets.
The markets are also looking nervously at any potential Russian incursion into Ukraine with an estimated 100,00 Soviet troops said to be near the border. A series of talks between the US and Russia have so far produced no tangible results, while US President Biden warned yesterday that Russia would pay a ‘heavy price’ if it invaded Ukraine.
The next area of support for Bitcoin is seen between $37.3k and $37.5k before a very important area of support between $29k and $30k comes into play. If this area holds then the market will likely turn higher and retrace higher, if not then sellers are likely to dominate price action and push the pair sharply lower.
Bitcoin Daily Price Chart January 21, 2022
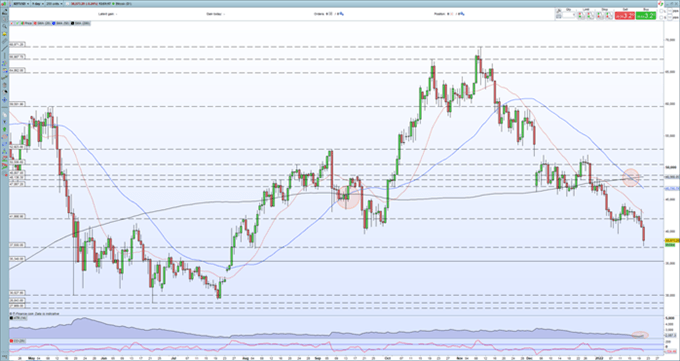
Chart via Pro Realtime
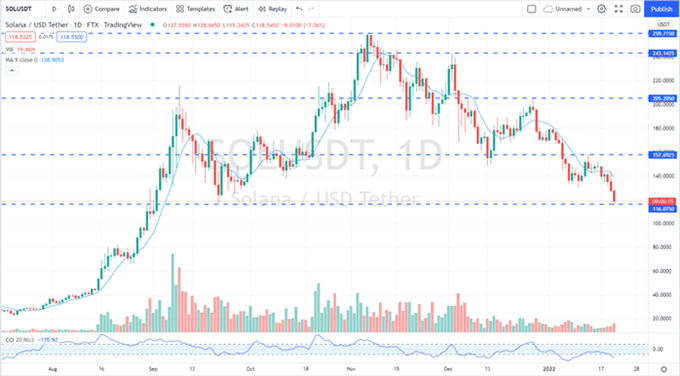
The Bitcoin sell-off caused major waves across the cryptocurrency space with all altcoins coming under heavy selling pressure, including the recent market favorites. Solana currently trades around $189 after having printed an ATH of $259 in early November….
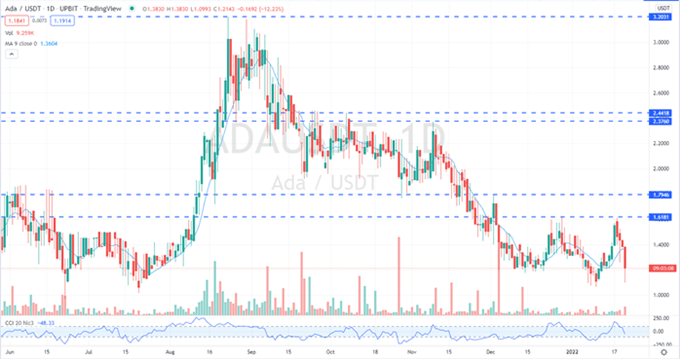
…while Cardano continues to print a series of lower highs, despite last week’s rally…
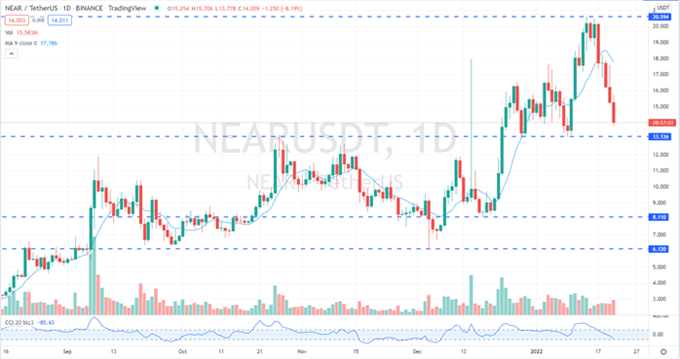
…the daily Near Protocol chart remains positive in the long term but in the short term may see further losses especially if the support area and last higher low around $13.13 are broken…
…while Harmony also needs to keep hold of the last higher low to enable it to push higher over a longer time frame.
Charts via TradingView
What is your view on Bitcoin – bullish or bearish?? You can let us know via the form at the end of this piece or you can contact the author via Twitter @nickcawley1.
element inside the
element. This is probably not what you meant to do!Load your application’s JavaScript bundle inside the element instead.
www.dailyfx.com