
GBP/USD - Prices, Charts, and AnalysisCentral bank commentary roils cable.The latest GDP update aside, the UK economic calendar is thin next week.
GBP/USD – Prices, Charts, and Analysis
- Central bank commentary roils cable.
- The latest GDP update aside, the UK economic calendar is thin next week.
Recommended by Nick Cawley
Download our New Q4 Forecast
The Bank of England (BoE) this week warned that the UK is likely to see a prolonged recession with the economy not expected to start expanding again until mid-2024. Higher energy and mortgage costs are seen reining in consumer spending, while unemployment, currently at a near five-decade low, is expected to increase significantly over the next three years, ‘with the jobless rate rising to almost 6.5%,’ according to the BoE. The UK central bank also hiked interest rates by 75bps to 3.0% to counter runaway inflation.
The Bank of England: A Forex Trader’s Guide
In a further blow to the currency, the BoE said that while inflation was expected to hit 11%, from a current level of 10.1%, it would likely fall sharply early-to-mid 2023 and that current market pricing for peak interest rates was too high. Against the backdrop of a weak economic outlook and rates lower than current market expectations, Sterling had little option but to fall further.
Trade Smarter – Sign up for the DailyFX Newsletter
Receive timely and compelling market commentary from the DailyFX team
Subscribe to Newsletter
The Federal Reserve released its latest monetary policy decision one day before the BoE and also raised its bank rate by three-quarters-of-one-percent. However, commentary by the Fed at the press conference left the market with a distinctly hawkish outlook. Chair Powell said that interest rates ‘have to go higher and stay higher for longer’ and that it is ‘premature’ to think that the Fed will pause soon. This commentary sent short-dated US Treasury yields soaring, pulling the US dollar along with them.
Fed Hikes Rates by 75 BPs and Alters Guidance, US Dollar Outlook Post-FOMC
For all market-moving data releases and economic events see the DailyFX Calendar.
The UK economic calendar is relatively thin next week aside from the monthly look at UK GDP. The market is already clear that the UK is going to enter into a recession and so these may not have as much market-moving potential as normal.
Cable is rallying into the weekend but this should not disguise the fact that fundamentally Sterling remains weak. Any further upside looks likely to be slow and limited and it may be that today’s move has a hint of pre-weekend short-covering. The next zone of resistance is between 1.1644 and 1.1738 and this should hold the pair in check. One positive sign on the daily chart is the series of lower highs has been broken and this may give cable some support.
GBP/USD Daily Price Chart
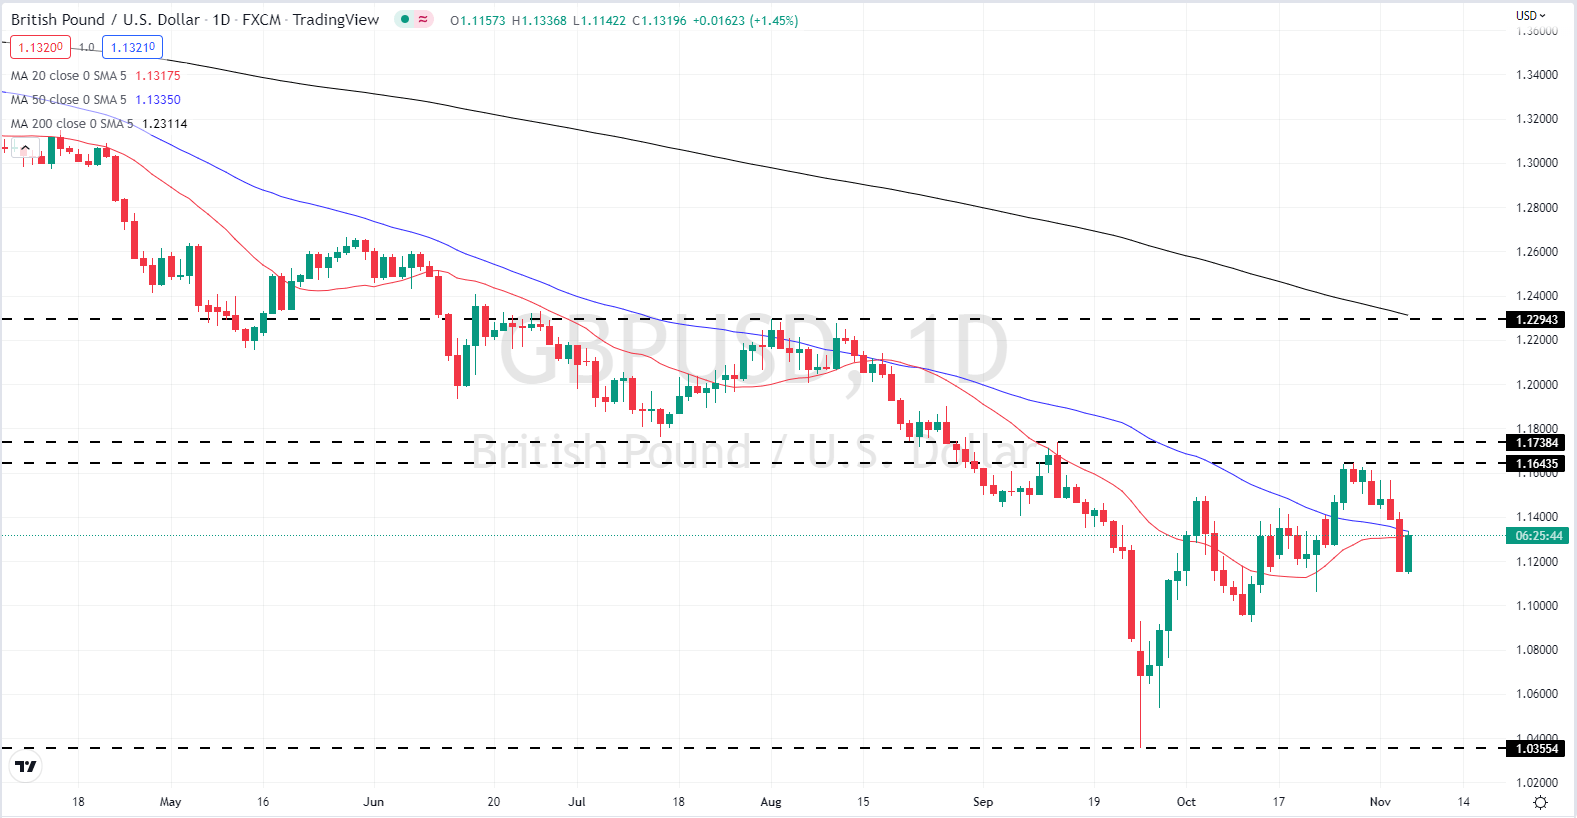
Chart via TradingView
A Big Swing in GBP/USD Positioning as Traders Boost Net-Longs
Retail trader data show 67.88% of traders are net-long with the ratio of traders long to short at 2.11 to 1.The number of traders net-long is 8.62% higher than yesterday and 37.05% higher from last week, while the number of traders net-short is 3.27% higher than yesterday and 28.29% lower from last week.
We typically take a contrarian view to crowd sentiment, and the fact traders are net-long suggests GBP/USD prices may continue to fall. Traders are further net-long than yesterday and last week, and the combination of current sentiment and recent changes gives us a stronger GBP/USD-bearish contrarian trading bias.
| Change in | Longs | Shorts | OI |
| Daily | -15% | 4% | -9% |
| Weekly | 18% | -26% | -3% |
What is your view on the British Pound – bullish or bearish?? You can let us know via the form at the end of this piece or you can contact the author via Twitter @nickcawley1.
element inside the
element. This is probably not what you meant to do!Load your application’s JavaScript bundle inside the element instead.
www.dailyfx.com