
Bitcoin (BTC/USD) Talking Points:Bitcoin (BTC/USD) loses steam after climbing to fresh all-time highsRisk sentiment and institutional interest con
Bitcoin (BTC/USD) Talking Points:
- Bitcoin (BTC/USD) loses steam after climbing to fresh all-time highs
- Risk sentiment and institutional interest continues to support the recent rise
- Is BTC/USD poised for bullish continuation or is a correction in order?
The analysis contained in article relies on price action and chart formations. To learn more about price action or chart patterns, check out our DailyFX Education section
Bitcoin Falls From Fresh ATH
Following the release of the first futures based Bitcoin ETF (‘BITO’), bulls trading BTC/USD drove the price of the first major cryptocurrency to a fresh all-time high of around $67,076 before falling back to the $65,000 handle.
With inflation pressures on the rise, the launch of the first ETF which tracks the price of Bitcoin futures boosted the demand for digital assets as institutions increased their holdings.
Visit DailyFX education to learn more about technical and fundamental analysis
Thus far, low interest rates have driven investors to higher yield assets, supporting both the equity market and cryptos. However, the release of the Proshares Bitcoin Strategy ETF Bito suggests that regulators may potentially be more open to the idea of allowing large institutions to use Bitcoin as a form of currency over time.
Bitcoin (BTC/USD) Price Action
After four consecutive weeks of gains, Bitcoin prices surpassed the prior high, in an attempt to claim the key psychological level of $70,000 which will likely continue to hold as resistance for the short-term move.
With price action currently tracking the 8-period EMA (exponential moving average) on the weekly time-frame, the CCI (commodity channel index) has risen into overbought territory, above the normal range of -100/+100.
Bitcoin (BTC/USD) Weekly Chart
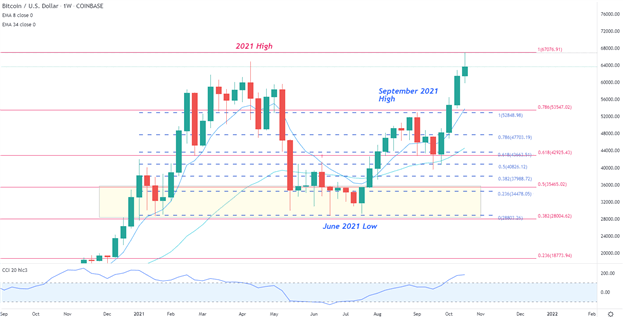
Chart prepared by Tammy Da Costa using TradingView
Meanwhile on the daily chart, BTC/USD price action is currently trading below $63,500 with the rising channel supporting current prices.
After a steep rally above the prior high, the upward trajectory lost momentum temporarily, allowing bears to drive prices back below $65,000.
Bitcoin (BTC/USD) Daily Chart
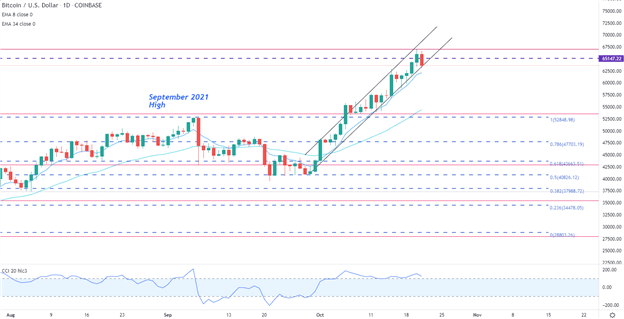
Chart prepared by Tammy Da Costa using TradingView
Bitcoin (BTC/USD) Key Levels
As with the weekly chart, the CCI on the daily chart remains in overbought territory with the 8-period EMA providing support at approximately $62,000.
For the imminent move, resistance continues to hold at $65,000 with the recent high providing an additional layer of resistance at $67,500.
However, should bears manage to break below trendline support, it may be probable for prices to fall back below $60,000 and back towards $55,000.
— Written by Tammy Da Costa, Analyst for DailyFX.com
Contact and follow Tammy on Twitter: @Tams707
element inside the
element. This is probably not what you meant to do!Load your application’s JavaScript bundle inside the element instead.
www.dailyfx.com