
S&P 500 OUTLOOK:The S&P 500 breaks out on the topside, reaching its best level since April 2022 following softer-than-expected U.S. inflation
S&P 500 OUTLOOK:
- The S&P 500 breaks out on the topside, reaching its best level since April 2022 following softer-than-expected U.S. inflation data
- May U.S. headline CPI clocks in at 4.0% y-o-y versus a market estimate of 4.1% y-o-y
- Softening price pressures may nudge the Fed to hold interest rates steady tomorrow
Recommended by Diego Colman
Get Your Free Equities Forecast
Most Read: Copper Rebound Gains Pace After the PBoC Lowered Chinese Borrowing Costs
The S&P 500 rose on Tuesday, extending gains from the previous session and reaching its best levels since April 2022, buoyed by positive mood on Wall Street after U.S. inflation figures bolstered the case for the Federal Reserve to pause its tightening campaign at its June meeting, which is scheduled to conclude tomorrow afternoon.
By way of context, annual headline CPI fell to 4.0% in May from 4.9% previously, one-tenth of a percent below expectations. This was the lowest reading in more than two years, a sign that the trend continues to move in the right direction. Meanwhile, core CPI remained sticky, cooling to 5.3% from 5.5% in April, with a 4.4% monthly surge in used car prices preventing more moderation.
On net, the CPI report may give the Fed cover to hold rates steady this week to buy time to assess the cumulative impact of past actions. While the FOMC is likely to retain a hawkish bias, a pause is nonetheless a welcome development in and of itself. For example, if the incoming data cooperates, there may not be a need to resume hikes in the future, a benign outcome for risk assets.
With sentiment on the mend and FOMO mentality pulling skeptical investors off the sidelines, the S&P 500 may have room to extend its upward trek in the near term, especially as market breadth has started to improve, indicating that more stocks are participating in the move higher. The Fed could still spoil the party, so traders should keep a close eye on its monetary policy decision and guidance tomorrow.
In terms of possible FOMC scenarios, an overly hawkish tone and aggressive interest rate forecasts in the dot-plot could sour the mood, leading to equity market weakness. Conversely, a softer message should be relatively bullish, giving equities more room to rally, at least until the reality of weaker fundamentals takes hold again.
| Change in | Longs | Shorts | OI |
| Daily | -4% | -3% | -4% |
| Weekly | -7% | -2% | -4% |
S&P 500 TECHNICAL ANALYSIS
The S&P 500 has extended higher after breaking above Fibonacci resistance near 4,315, a sign that upward momentum has not yet peaked. Despite the underlying bullish bias, caution is warranted as the index is approaching trendline resistance near 4,385 and entering overbought territory as shown by the 14-period RSI indicator.
In the event of a pullback from current levels, initial support appears at 4,325/4,315, but further losses could be in store on a push below this area, with the next downside target at 4,260, followed by 4,200. On the flip side, if the S&P 500 defies expectations and manages to clear the ceiling at 4,385 decisively, bulls may become emboldened to launch an assault on 4,420 and 4,500 thereafter.
Recommended by Diego Colman
Traits of Successful Traders
S&P 500 TECHNICAL ANALYSIS
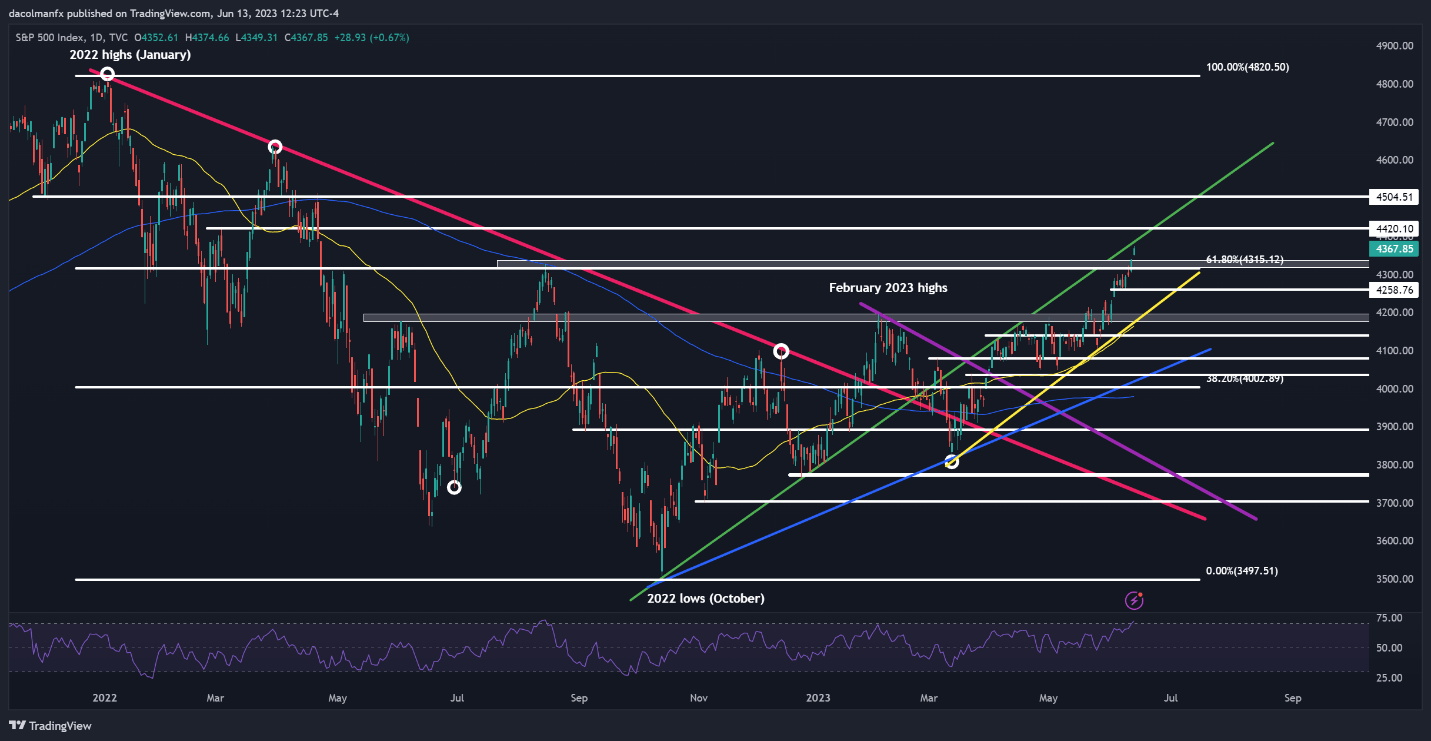
S&P 500 Chart Prepared Using TradingView
element inside the
element. This is probably not what you meant to do!Load your application’s JavaScript bundle inside the element instead.
www.dailyfx.com