
Crude Oil Price Talking PointsThe price of oil retraces the decline from earlier this week despite an unexpected rise in US inventories, and crude ma
Crude Oil Price Talking Points
The price of oil retraces the decline from earlier this week despite an unexpected rise in US inventories, and crude may stage a larger rebound over the coming days as it reverses ahead of the 50-Day SMA ($92.88).
Oil Price Forecast: Crude Recovers Ahead of 50-Day SMA
The price of oil has held above the 50-Day SMA ($92.88) since nearly the start of the year as it established an upward trend, with the moving average developing a positive slope during the same period as crude made its way to take out the 2021 high ($85.41).
Lack of momentum to push below the moving average may keep the price of oil afloat as it snaps the series of lower highs and lows carried over from last week, and the decline from the yearly high ($130.50) may turn out to be a correction in the broader trend especially as the Russia-Ukraine war disrupts the energy market.
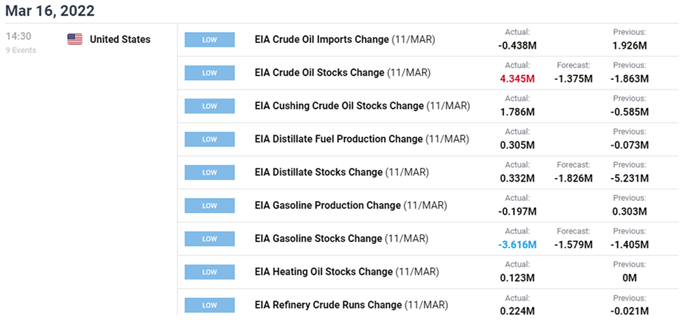
It remains to been if the Organization of Petroleum Exporting Countries (OPEC) will respond to the supply-side shock as US inventories increase 4.345M in the week ending February 25 versus forecasts for a 1.863M decline, but expectations for strong demand may encourage OPEC and its allies to retain the current production schedule as the most recent Monthly Oil Market Report (MOMR) states that “for the time being, world oil demand growth in 2022 remains unchanged at 4.2 mb/d, given the high uncertainty and extreme fluidity of developments in recent weeks.”
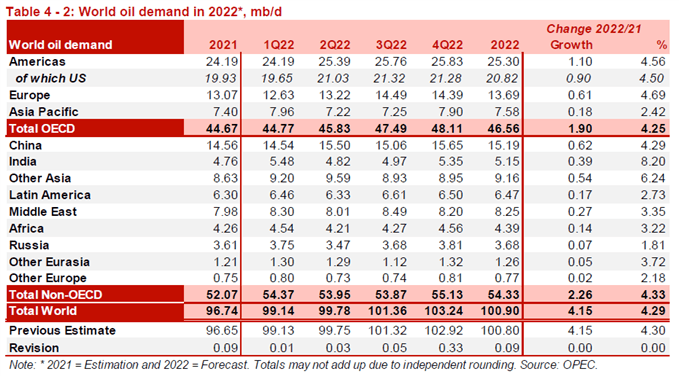
The report goes onto say that “this forecast is subject to change and will be adjusted when there is more clarity on the far-reaching impact of the geopolitical turmoil,” but current market conditions may keep the price of oil afloat ahead of the next Ministerial Meeting on March 31 as OPEC and its allies plan to “to “adjust upward the monthly overall production by 0.4 mb/d for the month of April 2022.”
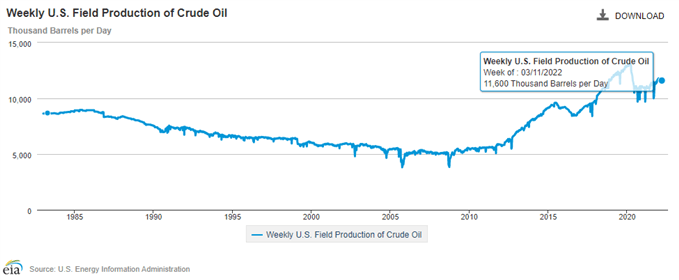
At the same time, the update from the Energy Information Administration (EIA) shows US production holding steady for six consecutive weeks, with the figure printing at 11,600K in the week ending March 11, and the price of oil may stag a larger recovery over the coming days as it snaps the series of lower highs and lows carried over from last week.
With that said, the decline from the yearly high ($130.50) may turn out to be a correction in the broader trend as the price of oil has helped above the 50-Day SMA ($92.88) since nearly the start of the year, and crude may stage further attempts to test the July 2008 high ($147.27) as long as it holds above the moving average.
Crude Oil Price Daily Chart
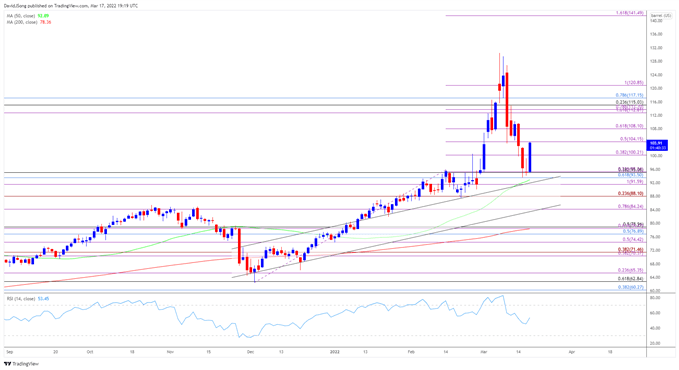
Source: Trading View
- Keep in mind, the price of oil cleared the August 2008 high ($128.60) as it jumped to a fresh yearly high ($130.50) earlier this month, with the recent rally pushing the Relative Strength Index (RSI) into overbought territory for the fourth time in 2022.
- However, a textbook RSI sell signal emerged as the price of oil reversed ahead of the record high ($147.27), with crude snapping the opening range for March as it came up against the $93.50 (61.8% retracement) region.
- Nevertheless, the decline from the yearly high ($130.50) may turn out to be a correction in the broader trend as the price of oil bounces back ahead of the 50-Day SMA ($92.88), and crude may stage further attempts to test the record high ($147.27) as long as it holds above the moving average.
- The failed attempt to break/close below the $93.50 (61.8% retracement) region has pushed the price of oil back towards the $104.20 (50% expansion) area, with a move above $108.10 (61.8% expansion) bringing the Fibonacci overlap around $112.80 (161.8% expansion) to $113.70 (78.6% expansion) back on the radar.
— Written by David Song, Currency Strategist
Follow me on Twitter at @DavidJSong
element inside the
element. This is probably not what you meant to do!Load your application’s JavaScript bundle inside the element instead.
www.dailyfx.com