
On Thursday, the Dogecoin price analysis remains bearish below the $0.3050 resistance level. Yesterday, DOGE/USD closed at $0.273400 after hitting
On Thursday, the Dogecoin price analysis remains bearish below the $0.3050 resistance level. Yesterday, DOGE/USD closed at $0.273400 after hitting a high of $0.289900 and a low of $0.271800. DOGE/USD reversed its course on Wednesday and dropped for the day despite the improvements in the whole cryptocurrency market.
The two leading cryptocurrencies, Bitcoin and Ethereum, reached new record highs on Tuesday as global inflation fears increased in the market. Furthermore, the ongoing era of cheap money has continued to support digital asset prices, as the Fed announced last week that it would taper asset purchases but did not mention an interest rate hike, which was widely anticipated in the market.
DOGE/USD
Analysts believe that the recent surge in BTC and ETH could have been driven by the inflows from investors seeking a hedge against inflation. The considerable stimulus support provided by central banks worldwide fueled inflation, which has decreased the value of money over time. At the same time, bitcoin has a fixed limit on the number of coins created, so it is being used as a hedge against inflation.
Furthermore, another reason behind the rising prices of cryptocurrencies could be that Tesla CEO Elon Musk was ready to sell 10% of his Tesla holdings. Analysts believe that Musk might reinvest some of his proceeds into cryptocurrencies as he has previously indicated he holds BTC, ETH, and DOGE.
The increased prices of cryptocurrencies like BTC and ETH improved the whole market mood but failed to affect Dogecoin. Dogecoin was experiencing bearish momentum due mainly to the increased popularity of its rival cryptocurrency, Shiba Inu. Last week, SHIB/USD saw massive gains, which pushed it to enter the list of top 10 cryptocurrencies by market cap. Rising SHIB coin inflows weighed on its rival meme-based coin DOGE, putting pressure on DOGE/USD.
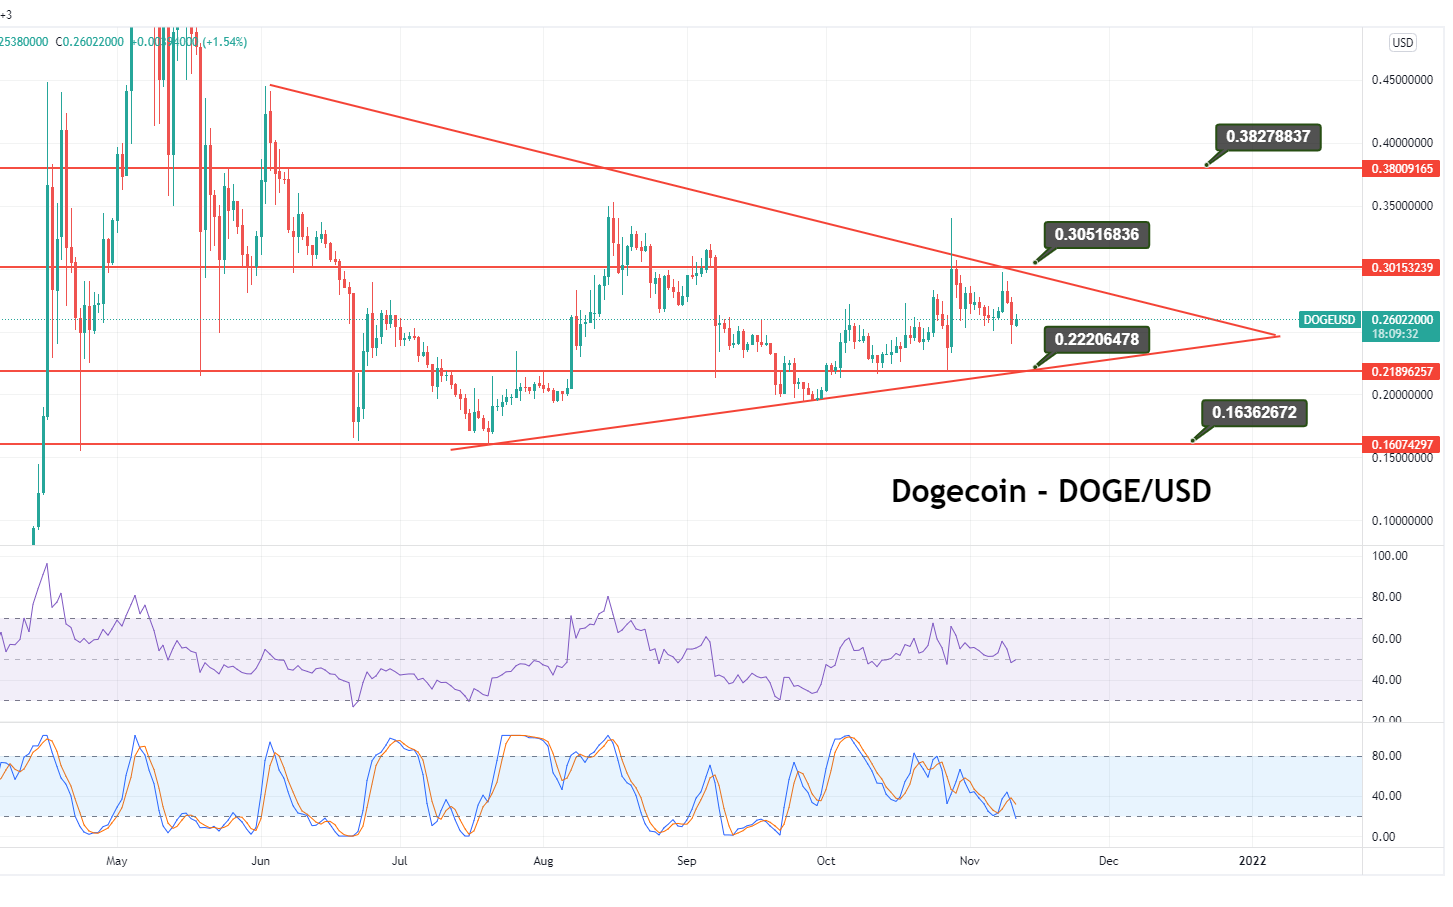
Dogecoin Price Analysis- A Quick Technical Outlook
Dogecoin (DOGE) fell from $0.29 on November 8, showing selling on rallies. The price has returned to the 20-day EMA ($0.26), which is a significant support level to monitor.
Daily Technical Levels
Support Resistance
0.266834 0.284934
0.260267 0.296467
0.248734 0.303034
Pivot Point: 0.278367
If the price rises over the present level, the bulls will try to push the DOGE/USD pair above $0.30 once more. If they succeed, the pair may be able to attack the overhead resistance at $0.34. A break and closure above this level will indicate that the bulls have won.
Alternatively, if the price falls below the 20-day EMA, the 50-day SMA ($0.24) might be the next stop. If this support is broken, the selling might become more intense, and the pair could fall to the strong support at $0.19.
www.fxleaders.com