
Euro (EUR/USD) Analysis and ChartThe Euro is struggling against a resurgent US dollar as rate-cut expectations between the two continue to widen. Tod
Euro (EUR/USD) Analysis and Chart
The Euro is struggling against a resurgent US dollar as rate-cut expectations between the two continue to widen. Today’s FOMC may underpin thoughts that the Fed is comfortable with rates staying higher for longer.
- No policy change is expected but the post-FOMC press conference may give some much-needed clarity.
- A bearish flag formation is pushing EUR/USD back toward a multi-month low.
Recommended by Nick Cawley
Get Your Free EUR Forecast
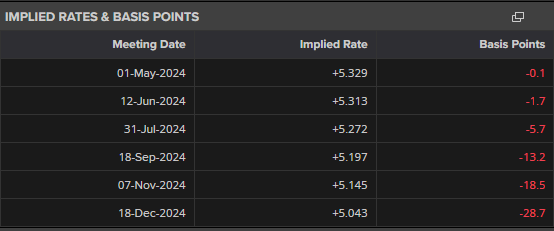
Today’s FOMC meeting is expected to see all policy dials left untouched as higher-than-forecast US inflation hampers the central bank’s plan to start cutting interest rates. Current market forecasts show the first 25 basis point cut will probably happen in November, with a growing likelihood that one rate cut will be it for this year.
The post-decision press conference will give Chair Jerome Powell to give his latest thoughts on the economy, although he is unlikely to give any forward guidance on when rate cuts can be expected. A neutral-to-hawkish tone can be expected from Chair Powell, reiterating a data-driven approach to upcoming monetary policy. After the press conference, Friday’s US Job Report will become the next market focal point before the weekend.
Learn how to trade news events with our expert guide
Recommended by Nick Cawley
Trading Forex News: The Strategy
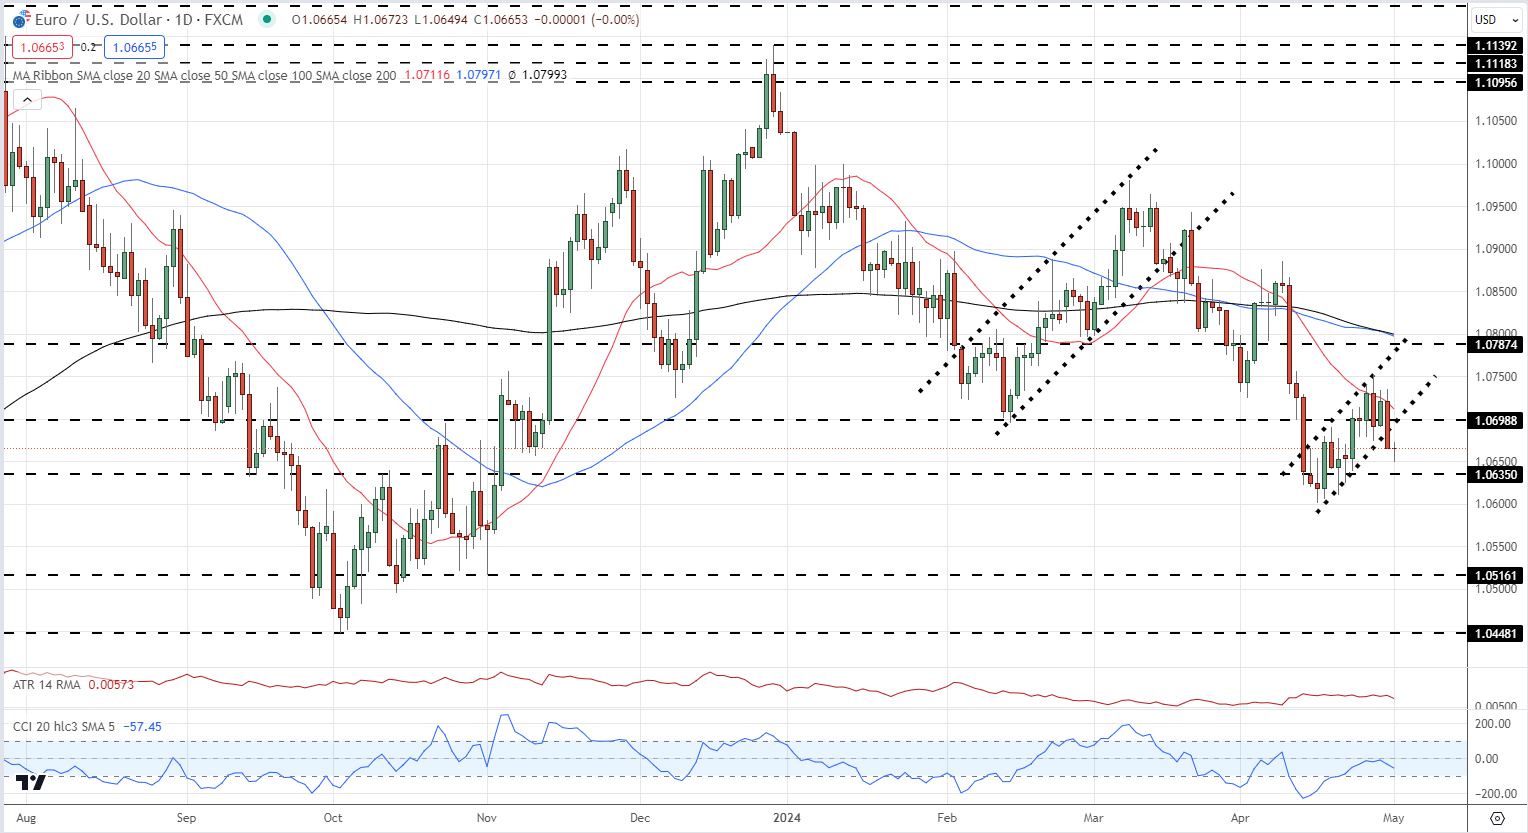
EUR/USD remains in a longer-term downtrend and the daily chart is showing a new, negative, candlestick formation. A second bearish flag formation is forming with trend support now broken, while an attempt to break above the 20-day simple moving average has failed. This leaves EUR/USD looking at lower prices with a break below the April 16 low of 1.0601 leaving 1.0512 the next level of interest. A break below the 1.0601 low will also continue a series of lower highs and lower lows that started at the end of last year.
A bearish flag is a technical analysis pattern that is considered a continuation pattern in a downtrend. It is a type of chart formation that typically occurs after a steep decline in price, followed by a period of consolidation, which resembles a flag-like shape on the chart. This pattern is used by traders to identify potential selling opportunities and to anticipate a continuation of the existing downtrend.
The formation of a bearish flag consists of two main parts, the flag pole – the initial sharp downward price movement that precedes the formation of the flag, and the flag – where the price action consolidates and forms a smaller, rectangular or parallel pattern. Traders can use bearish flag formations as continuation signals, entry points, and as a risk management aide.
EUR/USD Daily Price Chart
Retail trader datashows 61.29% of traders are net-long with the ratio of traders long to short at 1.58 to 1.The number of traders net-long is 10.83% higher than yesterday and 6.26% higher than last week, while the number of traders net-short is 6.83% lower than yesterday and 10.61% lower than last week.
We typically take a contrarian view to crowd sentiment, and the fact traders are net-long suggests EUR/USD prices may continue to fall.
| Change in | Longs | Shorts | OI |
| Daily | 11% | -9% | 3% |
| Weekly | 7% | -11% | 0% |
What is your view on the EURO – bullish or bearish?? You can let us know via the form at the end of this piece or you can contact the author via Twitter @nickcawley1.
element inside the
element. This is probably not what you meant to do!Load your application’s JavaScript bundle inside the element instead.
www.dailyfx.com
COMMENTS