: How to Trade the Beast")
*FTM undercuts major support level 1.00 then rallies 150+% in a few weeksFantom (FTM), which was relatively unknown in the past few months, has now
*FTM undercuts major support level 1.00 then rallies 150+% in a few weeks
Fantom (FTM), which was relatively unknown in the past few months, has now become one of the leaders in the cryptocurrency space. It recently hit all-time highs in early September, with a whopping 1,000+% gain from the lows of July. It then corrected and even undercut the major support level of 1.00, ralling by 150%.
In a previous article, dated September 13, I indicated four key support levels to observe for FTM. It broke below all four of these including the most important one, Level 4, before recovering:
| Support Levels | Price | Description | % from ATH |
| 1 | 1.40-1.50 | 23.60% Fib. and 10-Day MA | -28% |
| 2 | 1.25-1.30 | 38.20% Fib. | -36% |
| 3 | 1.10-1.15 | est. 20-day MA | -43% |
| 4 | 1.00 | Major Psychological Support Level | -48% |
Bear Trap
These types of moves are hard to digest if you are an inexperienced trader. Usually, bears would short a major support level, expecting more downside momentum, but in the case of FTM, it was not so. In hindsight, it was actually a bear trap – a fakeout.
Fakeouts result in Explosive Price Action
A good rule of thumb would be to understand that fakeouts like these, though misleading, often result in explosive price action in the opposite direction of the trade. This is evident in the way FTM recovered and then broke new all-time highs again, after a fakeout below 1.00. Keep a keen look-out for moves like these, as they present tremendous opportunities.
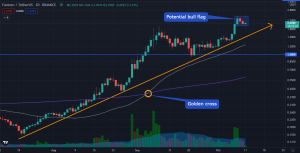
*FTM long-term uptrend intact, bullish Golden Cross present
FTM Trade Idea: Buy the Momentum
Fantom’s long-term technicals show a clear uptrend from the lows of July 2021. It has never fallen back to 1.00, despite a brief drop below this level during the correction in mid-September. It has since rocketed to all-time highs, and now the rally seems to be pausing. This is typical for any momentum move, and these types of patterns are the bread and butter of momentum traders.
What we see above is a potential bull flag: three small “pause” days accompanied by a slow-down in trading volume. This presents a pocket of opportunity to get into the trade if you were not able to buy the breakout.
Trade Summary:
Buy: In tranches
1st: 2.10
2nd: 2.30
3rd: 2.40-2.45
Stop loss: 1.94 (We need a tight stop since we are already late to the trade)
VAR: 0.50 to 1.00 (Risk only 0.50% to 1.00% of your portfolio for this trade)
Remember to always manage your risk. Sell into strength and get out of the trade at the first sign of weakness. Remember, this is a quick trade only: get in quick, get out quick!
www.fxleaders.com