
Yesterday we saw a decline in the US dollar, driven by a retreat in Treasury yields, which reversed the week’s previous USD gains. The market was met
Yesterday we saw a decline in the US dollar, driven by a retreat in Treasury yields, which reversed the week’s previous USD gains. The market was met with some mixed economic numbers, including a decrease in the GDP report’s inflation figures, disappointing trade data, and a significant drop in pending home sales.

These factors may have contributed to a sentiment that the economy is not experiencing a robust acceleration as previously anticipated. While some retailers reported soft results, others highlighted challenges expected in the second quarter, particularly in the housing market, with high FED rates continuing to push mortgage rates up, further dampening market optimism.
As a result, throughout the day, consistent dollar selling was observed, leading to an increase in the euro to 1.0845 from below 1.08, although towards the end of the day offers at 1.0850 sent the price down. Concerns arose in the stock market following the Salesforce and NVDA reports, which showed softer revenue, leading to minor safe-haven bids for the USD. Interestingly, the focus of market movements shifted towards the dollar, with the yen and Swiss franc advancing as safe havens.
The Swiss National Bank’s hawkish stance supported the Swiss franc. Despite a drop in oil prices, commodity currencies managed to reverse losses from the previous day. Crude oil prices presented a puzzle, rising earlier in the week on limited news and then falling despite reports suggesting OPEC might prolong production cuts until year-end.
Today’s Market Expectations
Today started with some important economic data from Japan and China. The Tokyo CPI inflation report which was released early in the morning showed
The Chinese Manufacturing and Services PMI reports were released next.
The upcoming Eurozone inflation report is anticipated to show a slight increase in the Headline CPI year-over-year (Y/Y) to 2.5%, up from 2.4% last year. The Core CPI Y/Y is expected to remain steady at 2.7%, matching the previous year’s rate. This data is significant as it could shape market expectations regarding future European Central Bank (ECB) rate decisions, especially after the June meeting. Should the inflation statistics come in higher than expected, in conjunction with recent strong Purchasing Managers’ Index (PMI) figures, wage growth, and robust labor market data, there is a high likelihood that market participants will reassess their expectations for ECB monetary policy. Currently, the market anticipates a 55 basis point reduction in rates by the end of the year. However, hotter-than-expected inflation data could prompt a shift towards a more hawkish stance, leading to a potential repricing of interest rate expectations.
The upcoming US Personal Consumption Expenditures (PCE) report is expected to provide important insights into inflation trends. The headline PCE Y/Y is forecasted to be 2.6%, a slight decrease from the previous year’s 2.7%. On a month-over-month (M/M) basis, the headline PCE is expected to rise by 0.26%, up from the prior reading of 0.32%. For the Core PCE, which excludes food and energy prices and is closely watched by the Federal Reserve, the Y/Y rate is predicted to be 2.75%, marginally down from 2.8% last year. The M/M Core PCE is expected to increase by 0.24%, compared to 0.32% in the previous year.
Yesterday was quite a dynamic day in the financial markets as the USD and bond yields reversed all the gains from the previous day. Despite the ups and downs, it’s great to hear that there were positive outcomes for traders. However we navigate through volatility and adapt to changing market conditions is a valuable skill, and we were able to capitalize on opportunities effectively. We achieved a net positive outcome, with 3 winning forex signals out of 4.
Gold Returns to the 20 SMA
Over the past two weeks, gold prices have been in a battle to regain their upward momentum. After reaching a record high of $2,450 on May 20th, the XAU/USD pair experienced a reversal and has since been trading in the lower $2,300s. This retreat in gold prices can be attributed to ongoing global concerns that have left gold traders cautious. Geopolitical uncertainties, particularly in regions like the Middle East, coupled with increasing central bank demand from BRICS countries, have contributed to gold’s appeal as a safe-haven asset. In response to heightened sanctions on countries like Russia and Iran, these nations are actively diversifying their assets away from the US dollar, further bolstering demand for gold. Earlier in the week, gold prices saw an increase after finding support at the 20-day Simple Moving Average. However, gains were limited on Wednesday as the price encountered resistance, preventing further upside movement. Overall, the recent fluctuations in gold prices highlight the ongoing tug-of-war between bullish and bearish factors influencing the market. While geopolitical tensions and central bank demand continue to support gold’s safe-haven status, traders remain cautious amidst uncertain global conditions, leading to choppy price action in the precious metal.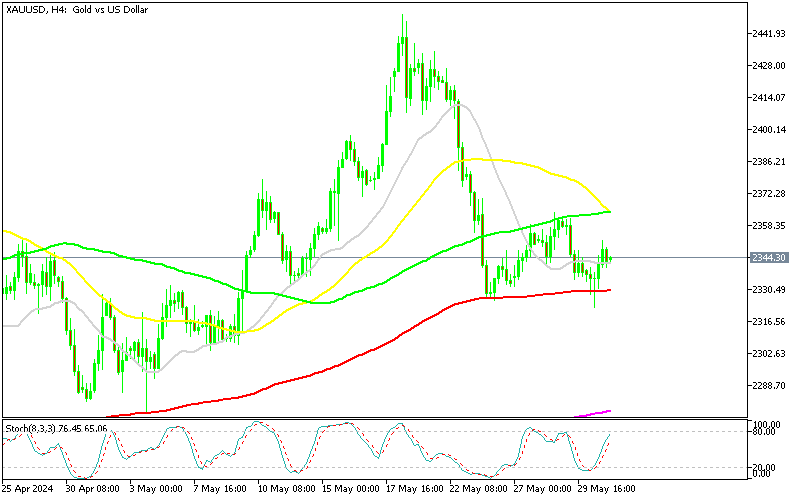
XAU/USD – Daily chart
NZD/USD Trades Between MAs
The USD/NZD exchange rate has demonstrated stability over the last two weeks, moving within a narrow band of 80 pips. This period of consolidation follows a climb earlier this month, where the exchange rate rose above the 0.61 level, primarily driven by weaker US CPI inflation data for April. The upward trend in the USD/NZD exchange rate aligns with the broader trend observed since early April, where the New Zealand dollar has shown relative strength against the US dollar. The pressure on the US dollar can be attributed to a series of weaker-than-expected US economic data releases. Despite these pressures, the market has remained largely constrained within a range defined by various moving averages during the latter half of May. This indicates a cautious trading environment where market participants are waiting for clearer economic signals before committing to more substantial directional moves.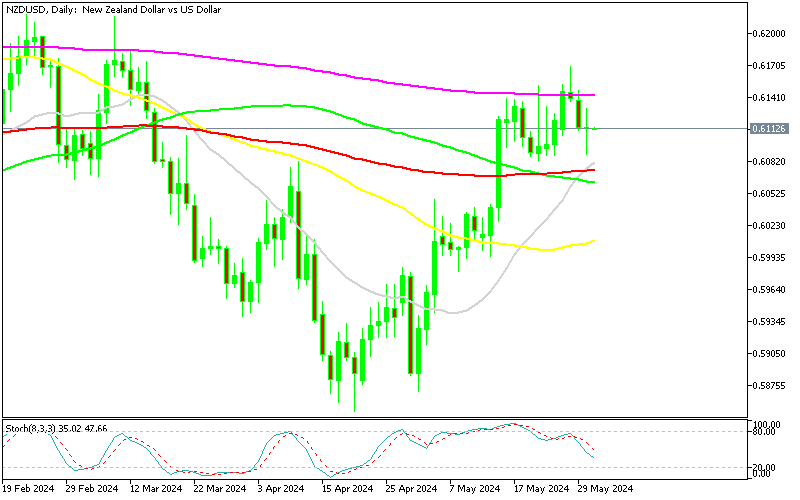
Cryptocurrency Update
Bitcoin Continues the Consolidation Close to $70K
Bitcoin’s long-term trend remains upward, with the 100-day Simple Moving Average (SMA) acting as a crucial support level. Historically, Bitcoin’s upward momentum has often been moderated by technical indicators such as the 20-day and 50-day SMAs. However, recent price action on the daily chart shows Bitcoin has successfully broken above both of these resistance levels, suggesting that the 50-day SMA is likely to serve as a new support level moving forward. Despite experiencing a three-day slump, Bitcoin continued its upward trajectory on Monday, surpassing the significant $70,000 mark. This resilience in breaking key resistance levels indicates strong bullish sentiment in the market. However, after this surge, Bitcoin’s price has fallen below the $70,000 level and is currently in a phase of consolidation.
Ethereum Within Reach of $4,000
The recent surge in confidence stemming from the SEC’s more favorable stance on spot Ether ETFs propelled Ether (ETH) to a record high of $3,832.50. This substantial increase from its previous high of approximately $3,000 marks a remarkable 25% rise in Ethereum’s value. Capitalizing on this positive momentum, we closed our buy Ethereum signal profitably yesterday. The approval of the Ethereum ETF is seen as a significant milestone, likely to spur greater institutional investment and broader adoption of Ethereum. This development is expected to enhance market stability and liquidity, further driving prices upward. The current bullish trend in Ethereum, fueled by the ETF news, indicates strong market confidence and robust investor demand. In this optimistic environment, Ethereum’s upward momentum may continue. However, we’re in a period of consolidation short term, and traders should remain vigilant about potential market corrections.
www.fxleaders.com