Reports are that there has been a retreat of some 10K of troops from the Russia/Ukraine border. That is some of what Pres. Biden said was 150K along t
Reports are that there has been a retreat of some 10K of troops from the Russia/Ukraine border. That is some of what Pres. Biden said was 150K along the border. Whether the numbers are accurate or not, there appeared to be some sort of retreat.
Moreover, there was a meeting between German Chancellor Scholz and Putin (which may have led to the decision to withdraw some troops) which is encouraging in that diplomacy has a potential vs a military or a sanction response. It also gets Germany/Europe talking to Russia vs US talking to Russia. Nevertheless, expect both side continue to use their respective tactics (including the US) to get their points across. I am not sure that Russia will suddenly withdraw 150K troops and the militia weaponry that accompanies those troops. However, the risks seem less than they were just 4 days ago (Friday) when reports were of an imminent attack that would involve all sorts of military action (he’ll probably invade tonight).
The actions was instrumental in a new market tone in the various financial markets.
In the European and US stock markets, the major indices all moved up by 1% o 2.5%. The Nasdaq and Russell 2000 led the way in the US (they are down the most from all -time highs too). The Italy’s FTSE MIB and German Dax led the way in the European markets.
The major stock indices in Europe and US all closed higher
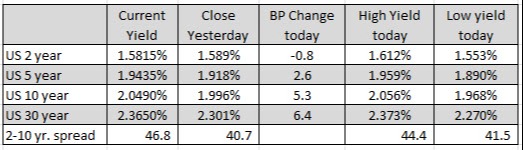
In the US debt market, the yields moved back higher – especially out the curve – as traders exited the flight to safety trade along with the yield curve flattening trade.
US yields moved higher and the yield curve steepened
In the forex, the EUR benefitted from the ebbing of the war risk on their eastern bank. The AUD and NZD also benefitted from risk- on flows. The safe currencies (CHF and JPY) along with the USD were the weaker of the majors today.
The strongest to weakest of the major currencies
The USD moved lower despite higher than expected PPI. The Fed and rate policy took more of a backseat to the developments from the Russia/Ukraine issues.
Looking at some of the major currencies:
EURUSD
EUR/USD
The EUR/USD is the currency pair encompassing the European Union’s single currency, the euro (symbol €, code EUR), and the dollar of the United States (symbol $, code USD). The pair’s rate indicates how many euros are needed in order to purchase one dollar. For example, when the EUR/USD is trading at 1.2, it means 1 euro is equivalent to 1.2 dollars. Why the EUR/USD is the Most Popular Trading PairCompared to all tradable currencies, the euro (EUR) is the world’s second most traded currency, behind only the US dollar. This currency pair is the most traded and liquid currency pair on the market.As the most popular trading pair, the EUR/USD is a staple of every brokerage offering and often has some of the lowest spreads relative to other pairs. Ultimately, the currency follows the two most economic blocs in the world and sees the most volume for this reason.The EUR/USD has a wide range of factors that influence its rates. From the EUR side, economic data in the Eurozone as well as internal factors in the bloc can easily impact rates. Even small member states can effectively weigh on the EUR, as seen in Greece during bailout talks in the 2010s. Alternatively, developments in the United States and the Federal Reserve commonly affect the EUR/USD. Many examples include the bailouts during the Financial crisis, tax cuts during the Trump Administration, and Covid-19 relief measures, among others.
The EUR/USD is the currency pair encompassing the European Union’s single currency, the euro (symbol €, code EUR), and the dollar of the United States (symbol $, code USD). The pair’s rate indicates how many euros are needed in order to purchase one dollar. For example, when the EUR/USD is trading at 1.2, it means 1 euro is equivalent to 1.2 dollars. Why the EUR/USD is the Most Popular Trading PairCompared to all tradable currencies, the euro (EUR) is the world’s second most traded currency, behind only the US dollar. This currency pair is the most traded and liquid currency pair on the market.As the most popular trading pair, the EUR/USD is a staple of every brokerage offering and often has some of the lowest spreads relative to other pairs. Ultimately, the currency follows the two most economic blocs in the world and sees the most volume for this reason.The EUR/USD has a wide range of factors that influence its rates. From the EUR side, economic data in the Eurozone as well as internal factors in the bloc can easily impact rates. Even small member states can effectively weigh on the EUR, as seen in Greece during bailout talks in the 2010s. Alternatively, developments in the United States and the Federal Reserve commonly affect the EUR/USD. Many examples include the bailouts during the Financial crisis, tax cuts during the Trump Administration, and Covid-19 relief measures, among others. Read this Term: The EURUSD is closing near the highs for the day. The high reached 1.1368. The current price is at 1.1358. The pair stalled within a swing area between 1.1359 and 1.1368. The falling 100 hour MA is just above the high of that swing area at 1.1372. In the new day, that area would need to be broken to increase the bullish bias. The 100 day MA and 200 hour MA are both near 1.1405 which would be the next major target on more upside momentum. If resistance holds around 1.1368 area, there is support near 1.1330 (low from Friday and from Feb 2).
GBPUSD
GBP/USD
The GBP/USD is the currency pair encompassing the United Kingdom’s currency, the British pound sterling (symbol £, code GBP), and the dollar of the United States of America (symbol $, code USD). The pair’s rate indicates how many US dollars are needed in order to purchase one British pound. For example, when the GBP/USD is trading at 1.5000, it means 1 pound is equivalent to 1.5 dollars. The GBP/USD is the fourth most traded currency pair on the forex exchange market, giving it ample liquidity and a low spread. Whilst the spreads of currency pairs vary from broker to broker, generally speaking, the GBP/USD often stays within the 1 pip to 3 pip spread range, making it a decent candidate for scalping. The GBP/USD pair, also informally known as “cable” (due to transatlantic cables being used to transmit its exchange rate via telegraph back in the 19th century) has a positive correlation with the EUR/USD, and a negative correlation with the USD/CHF. Trading the GBP/USDWhilst a lot of traders and even brokers will assert that the best time to trade the GBP/USD is during its most active hours during London and New York, doing so can be a double-edged sword due to the often-unpredictable nature of the pair. Its volatility also fluctuates often, and so what could be a profitable looking strategy one month, may not be so productive in later months. In addition, purely technical traders can really struggle to be consistent with this pair, (i.e. by ignoring fundamentals), due to the unique political nature of the United Kingdom. The recent drama surrounding Brexit has added another layer of uncertainty to this currency pair. With a smooth resolution not in the cards for the foreseeable future, it is clear the GBP/USD will be influenced by any developments and negotiations with the European Union.
The GBP/USD is the currency pair encompassing the United Kingdom’s currency, the British pound sterling (symbol £, code GBP), and the dollar of the United States of America (symbol $, code USD). The pair’s rate indicates how many US dollars are needed in order to purchase one British pound. For example, when the GBP/USD is trading at 1.5000, it means 1 pound is equivalent to 1.5 dollars. The GBP/USD is the fourth most traded currency pair on the forex exchange market, giving it ample liquidity and a low spread. Whilst the spreads of currency pairs vary from broker to broker, generally speaking, the GBP/USD often stays within the 1 pip to 3 pip spread range, making it a decent candidate for scalping. The GBP/USD pair, also informally known as “cable” (due to transatlantic cables being used to transmit its exchange rate via telegraph back in the 19th century) has a positive correlation with the EUR/USD, and a negative correlation with the USD/CHF. Trading the GBP/USDWhilst a lot of traders and even brokers will assert that the best time to trade the GBP/USD is during its most active hours during London and New York, doing so can be a double-edged sword due to the often-unpredictable nature of the pair. Its volatility also fluctuates often, and so what could be a profitable looking strategy one month, may not be so productive in later months. In addition, purely technical traders can really struggle to be consistent with this pair, (i.e. by ignoring fundamentals), due to the unique political nature of the United Kingdom. The recent drama surrounding Brexit has added another layer of uncertainty to this currency pair. With a smooth resolution not in the cards for the foreseeable future, it is clear the GBP/USD will be influenced by any developments and negotiations with the European Union. Read this Term: The GBPUSD had two failed breaks today – one to the upside and one to the downside. On the topside, the pair moved above the 100/200 hour MA and the 50% retracement targets between 1.3548 to 1.35526. The price moved up to 1.3566 in the early European session, before failing and then moving down to test the 100 day MA and a swing area between 1.3489 to 1.3501. The low reached 1.34858 before rotating back higher. The pair is ending the session near the high at 1.3535. Getting outside one of the technical targets (either above 1.3552 or below 1.3501) would likely lead to more momentum in the direction of the break.
USDJPY: The USDJPY is closing higher and in the process, has moved above a swing area that helped define an upper extreme in 2022 between 115.53 and 115.68. That swing area defined resistance ahead of the highs for the year at 116.33 from Jan 4 and more recently Feb 10. The price moved to a high of 115.738 before coming off in the NY afternoon session and closing in the aforementioned swing area at 116.52. If the price can get back above 115.68 in the new trading day, there is hope for more upside momentum in the new trading day. Absent that and a move back toward the rising 200 hour MA at 115.443 will be eyed. Break below that MA and the sellers should get more serious.
In other markets:
Spot gold is down -$17.87 or -0.94% at $1853.27 but before moving lower traded to the highest level since June 2021 at $1879.50. The low extended to $1844.61
Crude oil traded as high as $95.17 today which was short of the newest 7 year high of $95.82 reached during yesterday’s trading. The low was down to $90.66 today before closing the day near $91.94. The move lower today did see the price move back below the 200 hour MA currently at $91.19 but like the other dips in February, has not been able to extend far below the technical level.
Crude oil dipped below the 200 hour MA but could not stay
 on the Russia/Ukraine border")