
GBP/USD TECHNICAL OUTLOOK: BEARISHAfter breaking below 1.3200, GBP/USD has accelerated its decline, setting a new yearly low near 1.3050 before the w
GBP/USD TECHNICAL OUTLOOK: BEARISH
- After breaking below 1.3200, GBP/USD has accelerated its decline, setting a new yearly low near 1.3050 before the weekend
- Cable weakness could continue in the near term, especially in the absence of significant support zones around current levels that could serve as an inflection point
- In case of further losses, the 50% Fibonacci retracement of the 2020/2021 rally will become the immediate downside focus
Most read: UK GDP Beats Expectations, GBP/USD Refuses to Move Higher
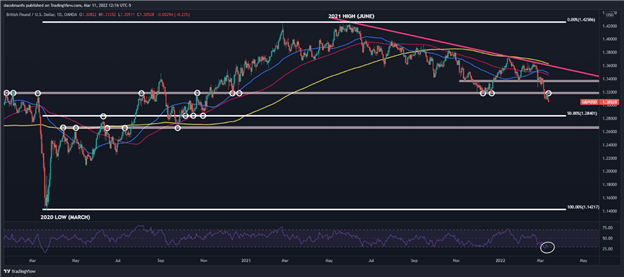
During the first three weeks of February, GBP/USD (British Pound – U.S. Dollar) rebounded sharply, rising about 200 pips from the monthly open level at 1.3445, but bullish impetus was stopped dead in its tracks after the pair collided with a medium-term trendline resistance near 1.3645. At that moment, bears resurfaced from their slumber, rejecting price lower and triggering a brutal sell-off that gave continuity to the downtrend started in June 2021.
The bearish bias was reinforced this week after GBP/USD finally breached the psychological 1.3200 level, a key reaction area that has acted as support or resistance on numerous occasions over the past two years, depending on the direction from which it was approached. As expected, the breakdown accelerated selling interest, setting the stage for a new yearly low near 1.3050 just before the weekend.
With cable trading below important moving averages (200-day, 100-day & 50-day), with flawless lower highs and lower lows, and with 1.3200 out of the way, the broader outlook remains tilted to the downside.In addition, deteriorating market sentiment stemming from the ongoing war in Ukraine is another negative catalyst to watch.
While it is true that GBP/USD looks oversold according to the 14-day RSI oscillator, I am not convinced that we are yet at an inflection point, especially in the absence of significant support zones in the vicinity that could help prop up the exchange rate. On that note, the next leg lower could be just around the corner, in which case, the 50% Fibonacci retracement of the 2020/2021 rally near 1.2840 becomes the immediate focus.
On the flip side, if bulls regain control of the market unexpectedly and manage to push price higher, the first technical resistance to consider lies around the 1.3200 handle. If we see a decisive move above this ceiling, buyers could become emboldened to launch on attack on 1.3365. At this point, the bullish reversal scenario seems unlikely, but should not be completely ruled out, especially if market sentiment were to improve and boost appetite for riskier currencies.
GBP/USD TECHNICAL CHART
GBP/USD chart prepared using TradingView
EDUCATION TOOLS FOR TRADERS
- Are you just getting started? Download the beginners’ guide for FX traders
- Would you like to know more about your trading personality? Take the DailyFX quiz and find out
- IG’s client positioning data provides valuable information on market sentiment. Get your free guide on how to use this powerful trading indicator here.
—Written by Diego Colman, Contributor
element inside the
element. This is probably not what you meant to do!Load your application’s JavaScript bundle inside the element instead.
www.dailyfx.com