
GBP/USD Analysis:Latest CoT data indicates bearish GBP Positioning Major risk events: UK GDP, US CPI GBP/USD Key Technical Levels‘Smart Money’ Return
GBP/USD Analysis:
- Latest CoT data indicates bearish GBP Positioning
- Major risk events: UK GDP, US CPI
- GBP/USD Key Technical Levels
‘Smart Money’ Returns to Bearish GBP Positioning
Large institutions and hedge funds (profit-seeking organisations) increased their short Sterling holdings while a decline in longs was also observed. This means that the overall ‘mood’ of the market has soured somewhat to the Pound as net- short positioning climbs once more. These bigger players in the market are often referred to as the ‘smart money’ due to their track record of positive returns and sophisticated market knowledge.
Prior to the latest data, the trend revealed reductions in shorts and a slow increase in longs (meaning a more bullish GBP bias) as the Pound climbed higher. As shorts and longs diverge, retail (IG) client sentiment is rather undecided as long and short traders are close to 50/50. Should GBP/USD continue to decline, history has shown us that retail sentiment tends to become more long (attempting to call the dip), while hedge funds pile into shorts.
Commitment of Trader’s Report -CFTC
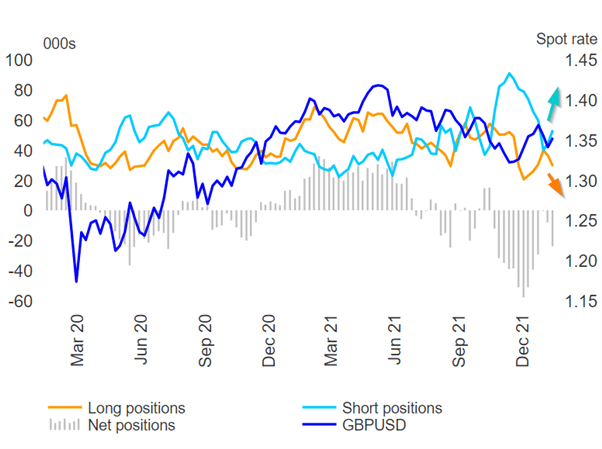
Source: Refinitiv, CFTC CoT Report
Major Risk Events for the Week Ahead
On Thursday we have US core and headline CPI data due with 7.3% estimated for headline inflation after the 40 year high of 7% reported for December. Given the current hawkish expectations around Fed monetary policy, a print inline with expectations may not have much of an effect on the pair but a beat could send GBP/USD lower. Then on Friday we see preliminary US Michigan consumer Sentiment.
Also on Friday, preliminary UK GDP is due for Q4 and December. The effects of Omicron, despite being mild, did result in weaker retail sales year on year in December which may carry over into the GDP numbers. Nevertheless, the GDP growth rate is forecast to be 6.5%
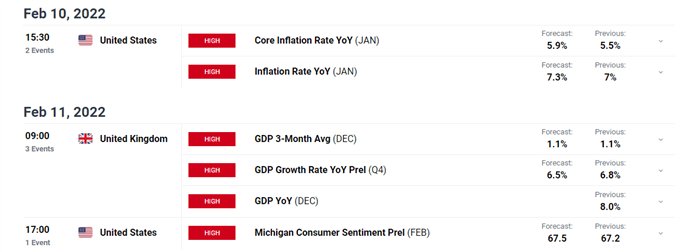
Customize and filter live economic data via our DaliyFX economic calendar
GBP/USD Key Technical Levels
GBP/USD trades around the 1.3515 level at the time of writing, coming off a half a percentage point on Friday after relatively strong US NFP jobs data. Should recent selling continue, the next level of support lies at 1.3410/1.3400 before 1.3280 which is still some distance away.
Should GBP/USD close convincingly above the 1.3515 level, 1.3600 becomes immediate resistance followed by 1.3675. The pair may continue in a rather choppy fashion as BoE and Fed rate hike expectations increase in tandem, offering little to support any clear and obvious trend.
GBP/USD Daily Chart
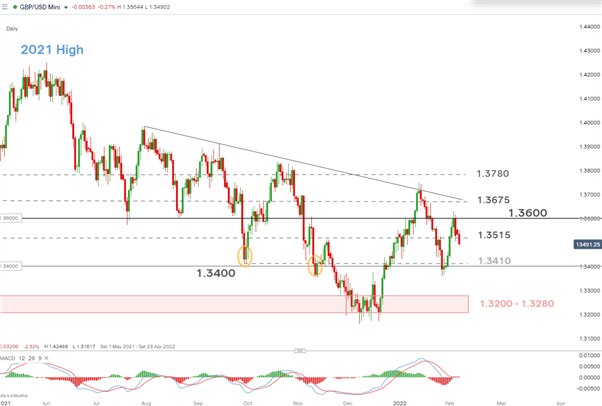
Source: IG, prepared by Richard Snow
The 4-hour chart shows the relative strength of the latest 4 hour candle, breaching the 1.3515 level.
GBP/USD 4 -Hour Chart
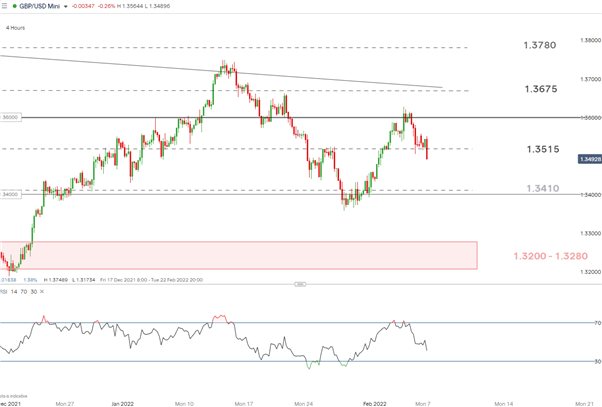
Source: IG, prepared by Richard Snow
— Written by Richard Snow for DailyFX.com
Contact and follow Richard on Twitter: @RichardSnowFX
element inside the
element. This is probably not what you meant to do!Load your application’s JavaScript bundle inside the element instead.
www.dailyfx.com