
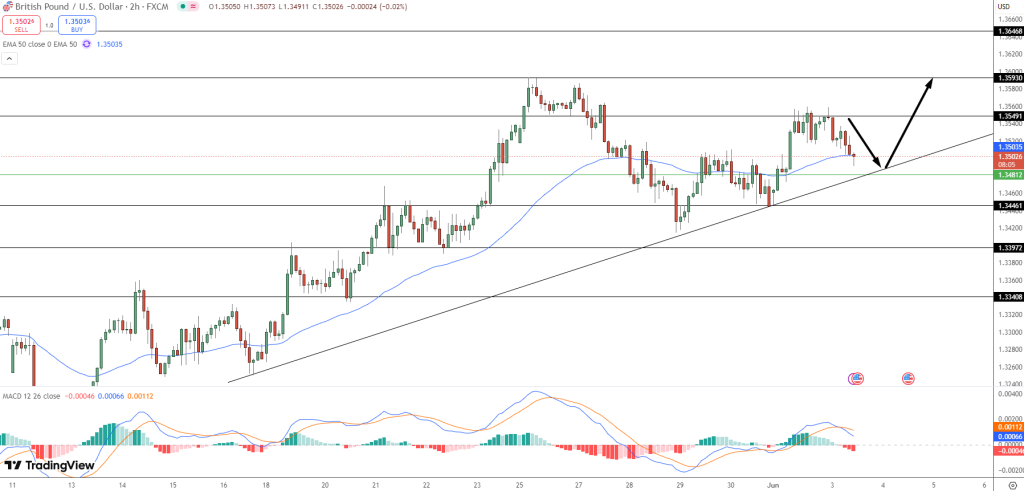
During the early European session on Tuesday, the GBP/USD pair slipped from its overnight highs near $1.3560, dropping toward $1.3520. This pullback
During the early European session on Tuesday, the GBP/USD pair slipped from its overnight highs near $1.3560, dropping toward $1.3520. This pullback aligns with a modest uptick in the US Dollar (USD) as the Dollar Index (DXY) rebounded from a six-week low. However, despite this dip, GBP/USD found solid support near $1.3481, an area strengthened by the uptrend’s lower boundary and the 50-period EMA on the 2-hour chart.
Recent price action has built a case for cautious optimism.
The pair’s series of higher lows since mid-May signal growing bullish intent. Meanwhile, the MACD histogram is fading in bearishness, and signal lines are nearing a potential bullish crossover—a classic precursor to upward momentum.
-
Support levels: $1.3481 (trendline and EMA), $1.3446
-
Resistance levels: $1.3539, $1.3593 (channel top)
Market Focus: BoE, Fed, and Key Data
The British Pound’s resilience stems partly from market anticipations that the Bank of England (BoE) will pause rate hikes at its June 18 meeting. While the BoE remains alert, investors believe the central bank may hold rates steady before considering further cuts. This perspective is limiting GBP/USD’s downside despite the pullback.
Traders are also watching today’s Bank of England Monetary Policy Report Hearings, where comments from Governor Andrew Bailey and the Monetary Policy Committee (MPC) could provide crucial hints on future policy. Across the Atlantic, the US dollar faces its headwinds, with upcoming US JOLTS Job Openings data and speeches from Fed officials expected to stir short-term volatility.
GBP/USD Trade Setup: Tactical Bullish Play
For traders, this setup offers a compelling opportunity:
-
Entry: Buy on a confirmed bullish bounce from $1.3481
-
Target: $1.3539 initially, with $1.3593 as an extended target
-
Stop-loss: Tight stop below $1.3446 to manage risk
You should watch for candlestick confirmations, such as a bullish engulfing or morning star pattern, at support. A break over $1.3539 could open the door for a test of $1.3593, while a drop under $1.3481 might signal a deeper correction to $1.3446 or $1.3397.
With a blend of technical signals, fundamental catalysts, and a tightening price structure, GBP/USD’s next move could be swift and decisive. Patience and precision are key in this setup.
www.fxleaders.com