
GBPUSD made a steep reversal in October and fell to 1.26, which held as support, however, this level has been broken now, opening the way
GBPUSD made a steep reversal in October and fell to 1.26, which held as support, however, this level has been broken now, opening the way for this year’s low at 1.23.

Since early October, the GBP/USD pair has faced strong selling pressure, driven by the Federal Reserve’s hawkish stance and lackluster UK economic data. Over this period, the pair has declined by 8.5 cents, reaching the 1.26 level last week as persistent USD strength dominated the market. Support near 1.26 proved resilient, allowing a brief recovery of one cent. However, the 200-day Simple Moving Average (SMA) acted as a ceiling, rejecting the price and pushing it back below 1.26 after a renewed advance in the USD.
GBP/USD Chart Daily – The 200 SMA Rejected the Price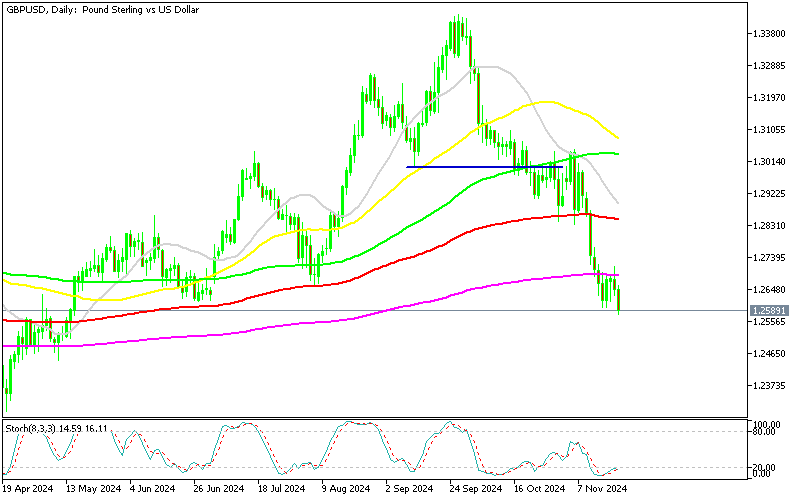
This week, UK inflation data for October revealed monthly increases of 0.6% in consumer prices and 0.4% in core prices, both exceeding expectations of 0.3% and 0.5%, respectively. Despite these higher-than-expected figures, the Bank of England attributed the rise to a one-off event, maintaining its current interest rate stance. The focus remained on core annual inflation, which surpassed forecasts as well as the previous month’s reading.
During the Bank of England Hearings, officials expressed cautious optimism that inflation might cool faster than previously anticipated, despite lingering concerns over wage pressures. They hinted at the possibility of gradual rate cuts totaling around 100 basis points over the next year, contingent on upcoming economic data. While markets welcomed this outlook, uncertainty surrounding the pair’s direction remains, as traders weigh the impacts of tightening US monetary policy against a potential easing bias from the BOE.
UK Retail Sales for October
GBP/USD Live Chart
GBP/USD
www.fxleaders.com