
In early July, the GBPUSD pair broke above 1.30, but last week’s weekly chart showed an inverted hammer candlestick, signaling a bearish
In early July, the GBPUSD pair broke above 1.30, but last week’s weekly chart showed an inverted hammer candlestick, signaling a bearish reversal. Since then, the price has fallen about 2 cents from the peak, indicating the bullish breakout was a false move. However, the decline paused today at the 50-day SMA (yellow), and the GBP has held up better against the USD compared to other major currencies.
GBP/USD Chart Daily – The 50 SMSA Held As Support at First Test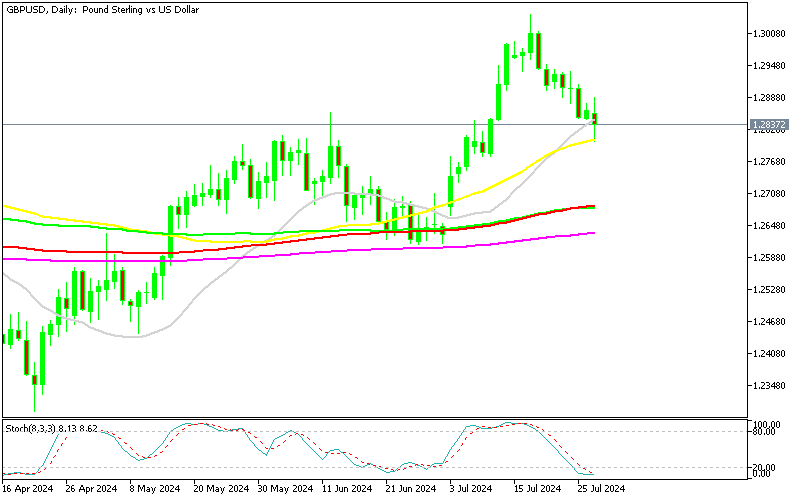
The US dollar weakened in the first two weeks of July due to various economic data releases and a decrease in consumer inflation. However, in the past two weeks, the dollar has regained strength as risk sentiment turned negative. This shift prompted the Bank of England (BOE) to consider a rate cut on Thursday, due to increasing signs of economic weakness in the UK, contributing to the bearish reversal in this forex pair. The GBP/USD pair continued its decline at the start of the week, following a broader sell-off that paused on Friday.
The potential 60% chance of a BOE rate cut at the upcoming policy meeting is putting pressure on sterling. Despite this, the GBP has performed relatively better than the Euro and commodity-linked currencies, even after the release of weaker-than-expected CPI and CBI Realized Sales data earlier today.
UK June Mortgage Approvals and CPI Sales
- UK June mortgage approvals: 59.98k (expected: 60.40k)
- May mortgage approvals: revised to 60.13k from 59.99k
- Net consumer credit: £1.2 billion (previous: £1.5 billion)
- CBI Realized Sales for June: -43k (expected: -20k)
- CBI Realized Sales for May: -24k
In June, UK individuals borrowed a total of £2.7 billion in mortgage debt. The annual growth rate for net mortgage lending increased to 0.5%, continuing a positive trend observed over the past few months.
GBP/USD Live Chart
GBP/USD
www.fxleaders.com