
GOLD prices dropped to $2,671.45 during Monday’s Asian session, reversing last week’s upward trend. The decline comes after a rejection at $2,719.75
GOLD prices dropped to $2,671.45 during Monday’s Asian session, reversing last week’s upward trend. The decline comes after a rejection at $2,719.75, a critical resistance level within a rising channel.
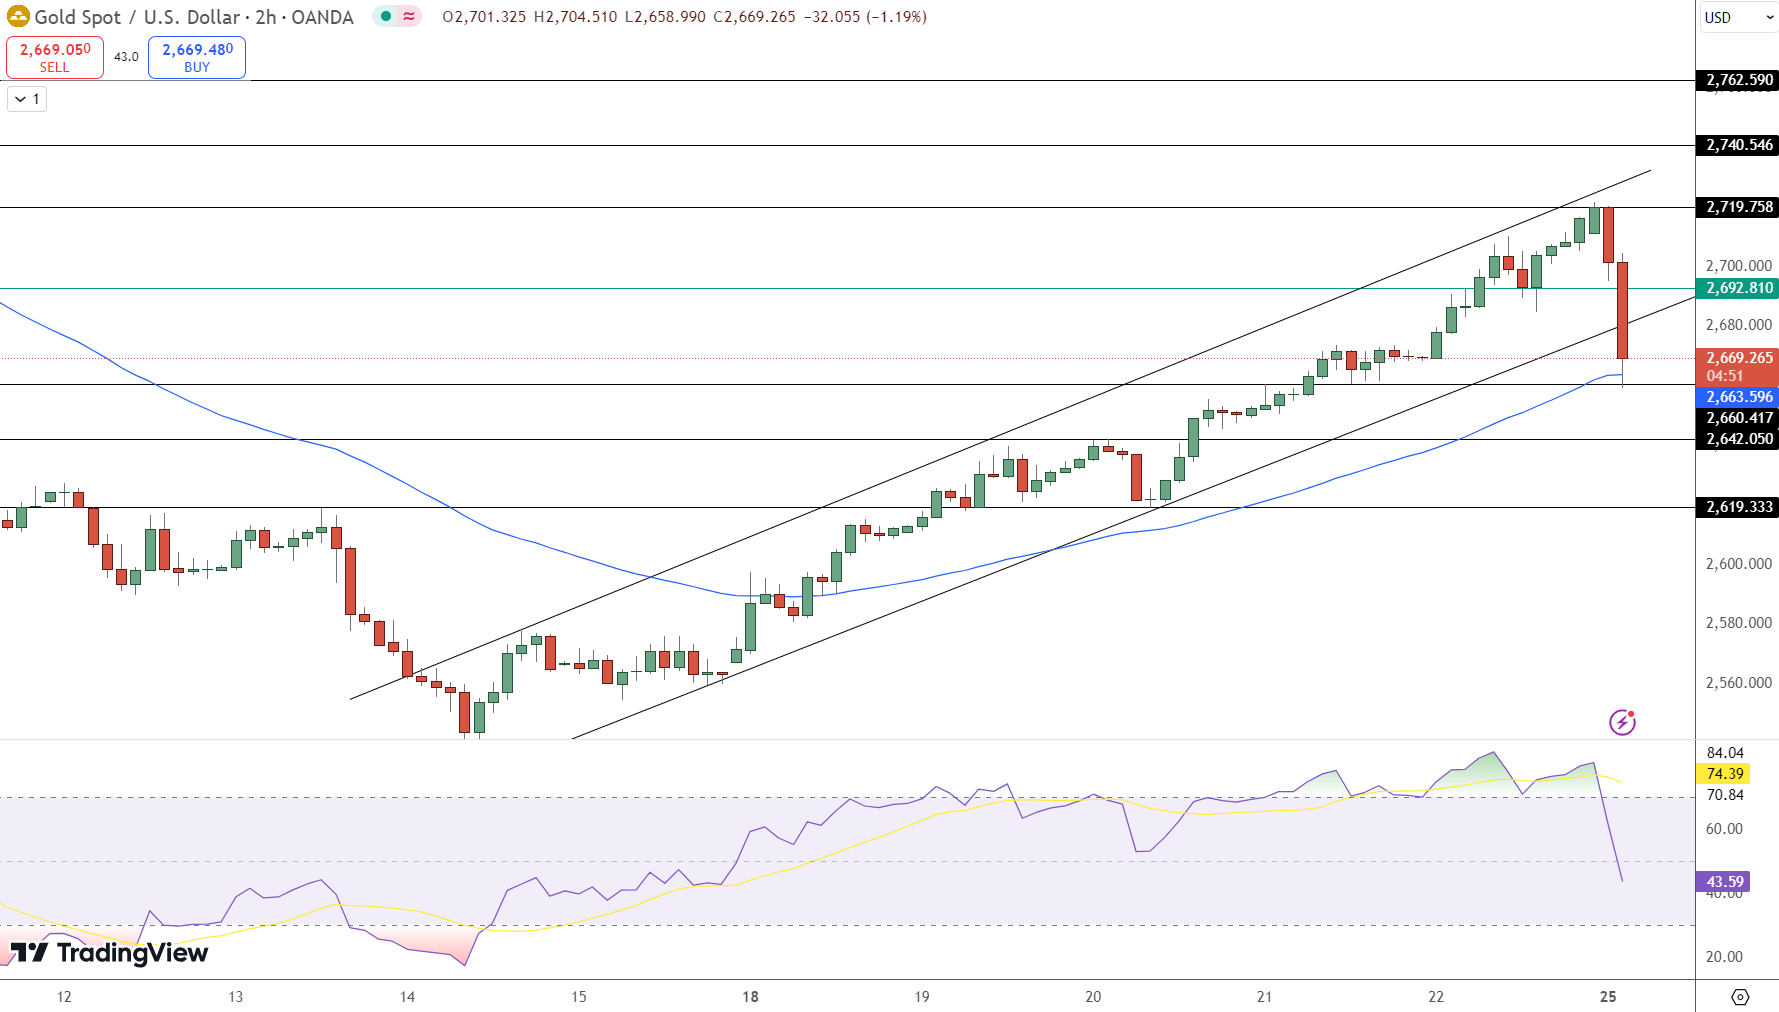
Gold has since fallen to test support levels near $2,660, signaling a pause in bullish momentum. The 50 EMA at $2,663 remains a key area of dynamic support.
The Relative Strength Index (RSI) has dropped sharply to 44.49, indicating a shift in sentiment toward bearish territory. A break below $2,660 could expose prices to the next support at $2,642.
However, if the $2,663 level holds, gold may attempt to rebound toward $2,692 and retest the $2,719 resistance level later in the week.
This pullback is also influenced by rising US Treasury yields and a mildly stronger US dollar, with the DXY index hovering near 107.00. Upcoming US economic data and Federal Reserve policy developments are set to shape gold’s near-term trajectory.
XAU/USD
Key US Events to Watch
A series of critical US economic events this week could impact both the US dollar and gold prices:
Tuesday, Nov. 26
- S&P/Case-Shiller Home Price Index (7:00 PM GMT): Expected at 5.1% YoY, down slightly from 5.2%.
- Consumer Confidence (8:00 PM GMT): Forecasted to rise to 112.0, up from 108.7. A stronger reading may support the dollar.
- New Home Sales: Forecasted at 724K, marginally lower than the previous 738K.
Wednesday, Nov. 27
- Preliminary GDP Q/Q (6:30 PM GMT): Expected at 2.8%, confirming moderate US growth.
- Unemployment Claims: Forecasted at 220K, slightly higher than last week’s 213K.
- Durable Goods Orders: Core orders are expected to grow by 0.2%, a slowdown from 0.5%.
- Core PCE Price Index (8:00 PM GMT): A key inflation gauge, expected to stay steady at 0.3%.
Thursday, Nov. 28
- FOMC Meeting Minutes (12:00 AM GMT): Traders will analyze Fed commentary on inflation and rate decisions, which could set the tone for December’s meeting.
Technical Levels to Watch
- Resistance Levels:
- $2,692: Immediate resistance if gold bounces from current levels.
- $2,719: Critical for a return to bullish momentum.
- $2,746: Long-term target in case of strong recovery.
- Support Levels:
- $2,663: Key short-term support (50 EMA).
- $2,642: Next major support zone.
- $2,619: Deeper support if bearish momentum persists.
- Momentum Indicator:
- RSI at 44.49 indicates a bearish shift, with room for further downside.
Conclusion:
Gold’s recent decline highlights the market’s cautious stance ahead of key US data and the FOMC minutes. While lower support levels may come into play, a rebound above $2,692 could reignite bullish sentiment. Traders should closely monitor inflation data and Federal Reserve commentary for further clarity.
www.fxleaders.com