
KCM Trade’s chief market analyst, Tim Waterer, described gold as operating in a “consolidation mode,” emphasizing market hesitation ahead of the antic
KCM Trade’s chief market analyst, Tim Waterer, described gold as operating in a “consolidation mode,” emphasizing market hesitation ahead of the anticipated economic data. Amid increasing trade tensions and global economic uncertainty, gold’s recent performance remains robust, hitting an all-time high of $2,956.15 on February 24, driven by escalating U.S. tariff concerns.
-
Recent record high: $2,956.15 (Feb 24)
-
Current consolidation price: $2,914
-
Key inflation data awaited: U.S. CPI
Trade Tensions Boosting Gold Appeal
U.S. tariffs, notably imposed by former President Donald Trump, continue to fuel concerns of heightened inflation and economic instability. Trump initially announced intentions to double steel and aluminum tariffs on Canada from 25% to 50%, a decision reversed within hours but enough to rattle markets and reinforce gold’s safe-haven status.
Gold historically thrives during periods of geopolitical uncertainty and economic instability. This trend persists today, as ongoing fears surrounding tariff wars and potential economic slowdowns position gold as a favored investment asset. According to Waterer, investors’ concerns over persistent “tariff dramas” ensure gold maintains its upward bias, as markets remain jittery.
-
Tariffs previously announced to double: 25% to 50%
-
Primary investor concern: Economic slowdown
-
Impact: Gold remains preferred hedge
Gold (XAU/USD) Technical Levels to Watch
Technically, gold prices are trading within a distinct symmetrical triangle pattern on the 4-hour chart, illustrating clear market indecision and potential volatility ahead. Gold holds slightly above its 50-period Exponential Moving Average (EMA) around $2,906, signaling cautious optimism among traders.
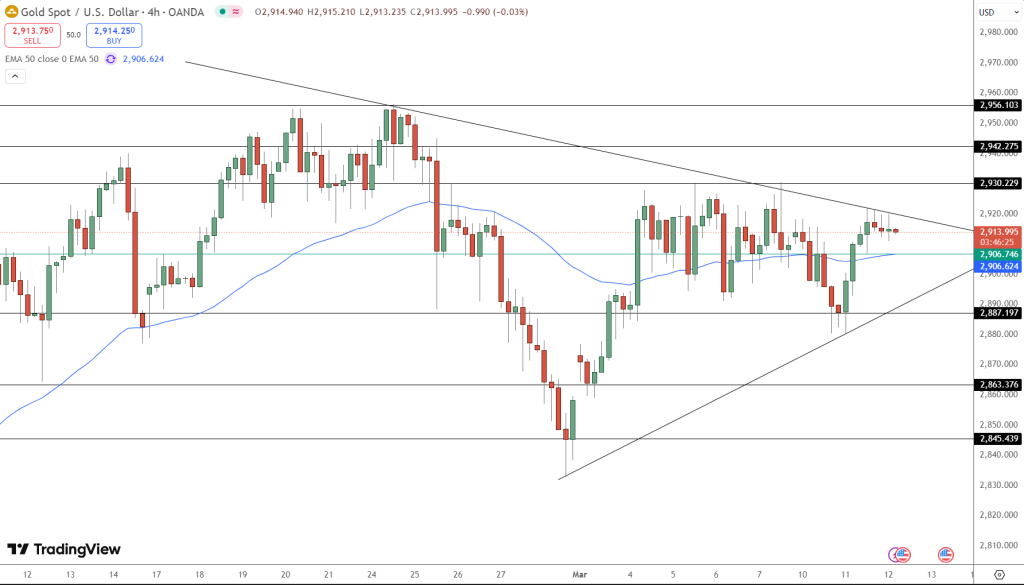
For bullish momentum to accelerate, gold must decisively break the upper boundary near $2,920. A successful breakout at this level could swiftly propel the precious metal toward immediate resistance points at $2,930, subsequently targeting the significant psychological barrier of $2,942.
Conversely, a bearish scenario would unfold if gold prices breach the triangle’s lower trendline around the critical $2,900 mark. Such a move could attract intensified selling pressure, possibly driving prices down toward the immediate support at $2,887, followed by a deeper test at $2,863.
Market participants should closely monitor volume and price movements near these pivotal boundaries, as the forthcoming breakout or breakdown will likely determine gold’s next significant directional trend.
-
Bullish Breakout Targets: $2,920 → $2,930 → $2,942
-
Bearish Breakdown Targets: $2,900 → $2,887 → $2,863
In conclusion, gold traders stand at a critical crossroads, closely evaluating inflationary signals, geopolitical developments, and technical chart patterns. Each of these elements plays a crucial role in determining whether gold continues its bullish run or enters a phase of renewed downward pressure. Investors must stay informed and prepared to adapt swiftly to market shifts.
www.fxleaders.com