
Gold Price (XAU/USD), Chart, and AnalysisUS inflation data and next week’s FOMC decision will determine gold’s outlook. Client sentiment data shows r
Gold Price (XAU/USD), Chart, and Analysis
- US inflation data and next week’s FOMC decision will determine gold’s outlook.
- Client sentiment data shows retail increasing net-long positions.
Today’s US core PCE release (12.30 GMT) and next week’s FOMC policy decision and commentary will steer the price of gold in the short term. Inflation in the US remains at elevated levels and is not seen moving appreciably lower, while the Fed will hike rates by 50 basis points next week, and likely at the next two meetings as well, and give greater clarity about their quantitative tightening program which is expected to start imminently. A backdrop of sharply rising interest rates and unsustainably high inflation will weigh further on the precious metals in the weeks ahead.
For all market-moving data releases and events, see the DailyFX Economic Calendar.
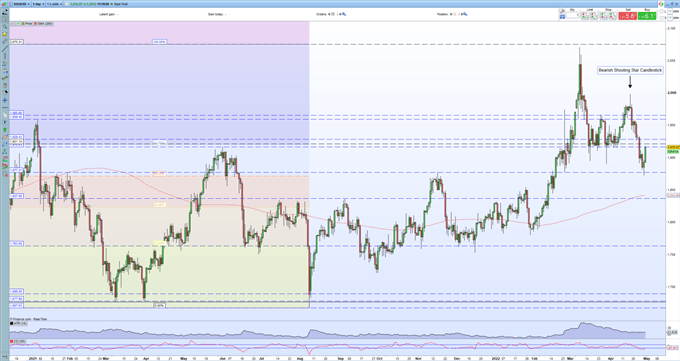
In a report I published earlier this month I highlighted a strong bearish technical signal – a bearish shooting star candle – on the daily gold chart that suggested that the recent uptrend was about to reverse. This signal played out perfectly and sent gold nearly $110/oz. lower over the next 9 days.
Gold Price – Feeling the Strain as US Treasury Yields Continue to Rise
Retail trade data – see below – shows that investors continue to build net-long positions in gold over the past week. We use client sentiment data as a contrarian indicator and this suggests that gold may fall further.
The daily chart shows gold trading around an old technical level of note on either side of $1,916/oz. This level turned from resistance to support over the prior months and now is acting as resistance again. This level also guards an old 61.8% Fibonacci level at $1,921/oz. from the August 2020-August 2021 sell-off. Support at $1,877/oz. held a second test yesterday and will act as first-line support to any move lower.
Fibonacci Application in Financial Markets
Gold Daily Price Chart – April 29, 2022
Retail trader data show 81.99% of traders are net-long with the ratio of traders long to short at 4.55 to 1. The number of traders net-long is 2.45% higher than yesterday and 3.46% higher from last week, while the number of traders net-short is 5.79% lower than yesterday and 26.30% lower from last week.
We typically take a contrarian view to crowd sentiment, and the fact traders are net-long suggests Gold prices may continue to fall. Traders are further net-long than yesterday and last week, and the combination of current sentiment and recent changes gives us a stronger Gold-bearish contrarian trading bias.
What are your views on Gold – bullish or bearish?? You can let us know via the form at the end of this piece or you can contact the author via Twitter @nickcawley1.
element inside the
element. This is probably not what you meant to do!Load your application’s JavaScript bundle inside the element instead.
www.dailyfx.com