
GOLD, XAU/USD, REAL YIELDS, INFLATION, US DOLLAR - Talking PointsGold has been moving sideways as markets take stock of recession riskReal yields hav
GOLD, XAU/USD, REAL YIELDS, INFLATION, US DOLLAR – Talking Points
- Gold has been moving sideways as markets take stock of recession risk
- Real yields have taken respite, but the upward trajectory is intact for now
- A range breakout might happen. Which side is vulnerable for XAU/USD direction?
Gold has been languishing in a range of US$ 1,807 – 1879 for seven weeks as rising interest rates and inflation expectations weigh against the perceived safe-haven status of the yellow metal.
Most global central banks are lifting rates at the fastest pace in generations to combat wealth-bleeding inflation readings and rein in ultra-loose monetary policy.
There is little doubt that supply chain shocks have contributed to the rapid prices rises, but if consumers have more money than would otherwise be the case, then competition to pay more for goods is exasperated.
A significant threat for central banks is when inflation expectations become entrenched, hence the race to take out the slack. The Fed have maintained their rhetoric around taking the inflation fight seriously.
A concern with that battle is the probability of a soft landing for the economy being quite difficult without supply chains loosening up – something beyond any central banks’ remit.
The rising risks of recession has seen nominal yields pause from their parabolic path and at the same time, market-priced inflation expectations have been lowered. This has seen real yields remain steady over the last week or so. A real yield is the nominal rate less the inflation rate for the same tenure.
A potential risk for the gold price is the possibility of real yields resuming their upward trajectory. This could occur if inflation expectations go lower or if nominal yields go higher. A higher nominal yield might see a higher US Dollar, something that has potential to undermine gold.
GOLD AGAINST US 10-YEAR REAL YIELD,US 10-YEAR NOMINAL YIELD, USD (DXY) INDEX
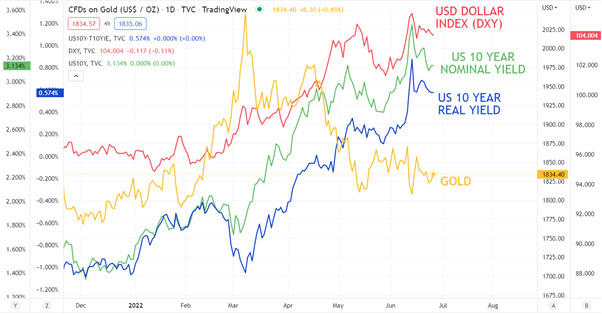
Chart created in TradingView
GOLD TECHNICAL ANALYSIS
In March, the gold price rallied to a peak of 2,070.42 but fell short of the all-time high of 2,075.14 seen in July 2020 creating a Double Top. In the bigger picture, this failure to break higher could be a bearish signal.
Since that March high, gold has been in a descending trend channel. More recently, it has been in range trading mode since early May.
Just above the price is the 21- and 200-day Simple Moving Averages (SMA). A clean break above them might see bullish momentum emerge.
Resistance could be at the recent high of 1,879 or just below there at the 55-day SMA and a descending trend line.
Support may lie at the recent lows of 1,807, 1,805 or 1,787.
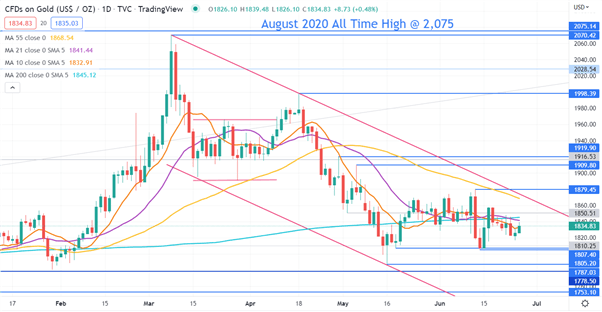
Chart created in TradingView
— Written by Daniel McCarthy, Strategist for DailyFX.com
To contact Daniel, use the comments section below or @DanMcCathyFX on Twitter
element inside the
element. This is probably not what you meant to do!Load your application’s JavaScript bundle inside the element instead.
www.dailyfx.com