


GOLD ANALYSIS
- Dollar upside may be limited.
- Gold’s safe-haven appeal indifferent.
- XAU/USD holds its head above $1800.
- IG client sentiment points to short-term upside.
BULLION FUNDAMENTAL BACKDROP
Despite the bullish dollar outlook and soaring U.S. Treasury yields this year, gold prices have respectfully maintained relatively valuations. Its safe-haven draw is largely eliminated from the equation at this point as markets seem to have shown its hand regarding the Omicron variant (minimal economic impact). A positive for gold has come from the uptick in gold volatility via the Cboe Gold ETF Volatility Index (GVZ) seen below. Traditionally, gold prices have a positive correlation with this index and should key economic data surprise markets this week, we may see a continuation of the year end rise in the GVZ index and consequently support for gold prices.
CBOE GOLD ETF VOLATILITY INDEX (GVZ):
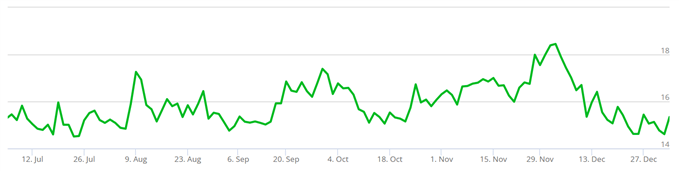

Source: CBOE
Rising U.S. Treasury yields have been the flavor of the month thus far and continues to extend its escalation towards 1.7% (10-year). We have seen this level hold as resistance last year (white) so while fundamentals currently favor further upside, 1.7% remains a key level to watch.
U.S. 10-YEAR TREASURY YIELD:
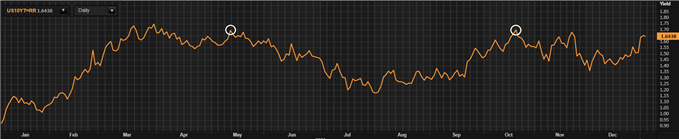

Source: Refinitiv
Real yields (see graphic below) are rising as bond yields sore thus decreasing the differential with inflation. This being said, inflation may be dissipating after yesterday’s ISM Manufacturing PMI’s revealed a significant drop in the prices paid component of the data release. This may be a sign that inflation is fading and could lead to curbing the rate of acceleration on real yields.
TREASURY REAL YIELD CURVE RATES 5,10-YEAR:
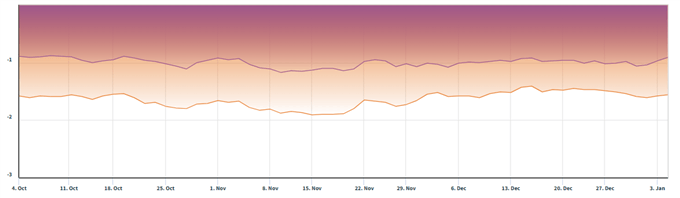

Source: Nasdaq Data Link
GOLD ECONOMIC CALENDAR
USD movers this week are shown below with ADP employment change for December also scheduled for later today. Not much is expected from the FOMC minutes and should not result in any significant USD and gold price movement. Non-manufacturing data and NFP are the highlights for the week and should provide some insights into the appropriateness of the Fed’s current outlook. ISM non-manufacturing data will be watched closely with particular reference to the prices metric (inflation).
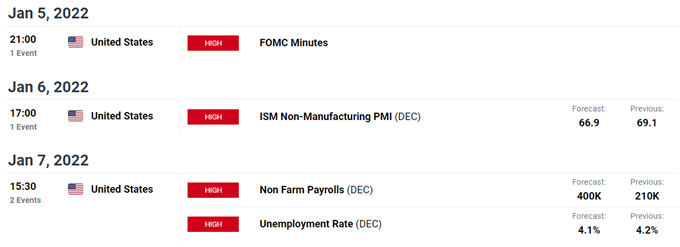

Source: DailyFX Economic Calendar
TECHNICAL ANALYSIS
GOLD PRICE DAILY CHART
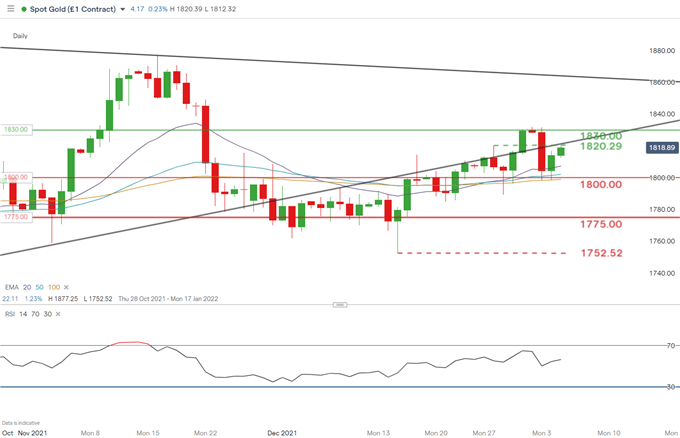

Chart prepared by Warren Venketas, IG
Gold’s year-end rally in 2021 is holding up well considering the slew of opposing forces on the yellow metal. Bulls have been fervent in their defense of the 1800.00 psychological handle and remains a key level that could divide bullish and bearish momentum. This week’s high impact events mentioned above should provide some directional stimulus for gold in early 2022.
Resistance levels:
Support levels:
- 1800.00
- 100-day EMA (yellow)
IG CLIENT SENTIMENT BULLISH
IGCS shows retail traders are currently distinctly long on gold, with 72% of traders currently holding long positions (as of this writing). At DailyFX we typically take a contrarian view to crowd sentiment and the fact traders are net-long is suggestive of a short-term bearish inclination however with the recent net change and plunge into short positions (+58%) the outlook favors gold bulls.
Contact and follow Warren on Twitter: @WVenketas
element inside the
element. This is probably not what you meant to do!Load your application’s JavaScript bundle inside the element instead.
www.dailyfx.com