
GOLD PRICE FORECAST:Gold prices begin the week on the back foot, undermined by rising U.S. yieldsThe Fed’s monetary policy decision will take the spot
GOLD PRICE FORECAST:
- Gold prices begin the week on the back foot, undermined by rising U.S. yields
- The Fed’s monetary policy decision will take the spotlight on Wednesday
- This article looks at key technical levels to watch on gold
Recommended by Diego Colman
Get Your Free Gold Forecast
Most Read: US Dollar’s Direction Hinges on Fed’s Policy Outlook, US Labor Market Data
Gold prices were on a wild ride on Monday in a session characterized by thin volume, with most European markets closed because of the Labor Day holiday in the region. Bullion first recaptured the psychological level of $2,000, but was unable to sustain gains and quickly dropped, falling back below that threshold after U.S. macroeconomic data beat estimates. (XAU/USD down 0.40% to $1,990 at the time of writing).
By way of context, the ISM manufacturing PMI was better than forecast in April, rebounding modestly to 47.1 versus 46.8 expected. While the goods-producing sector contracted for the sixth straight month, the employment and prices paid components of the survey surged to 50.2 and 53.2 respectively, up from 46.9 and 49.2 previously, bolstering the U.S. dollar and Treasury yields across the curve.
US ECONOMIC DATA AT A GLANCE
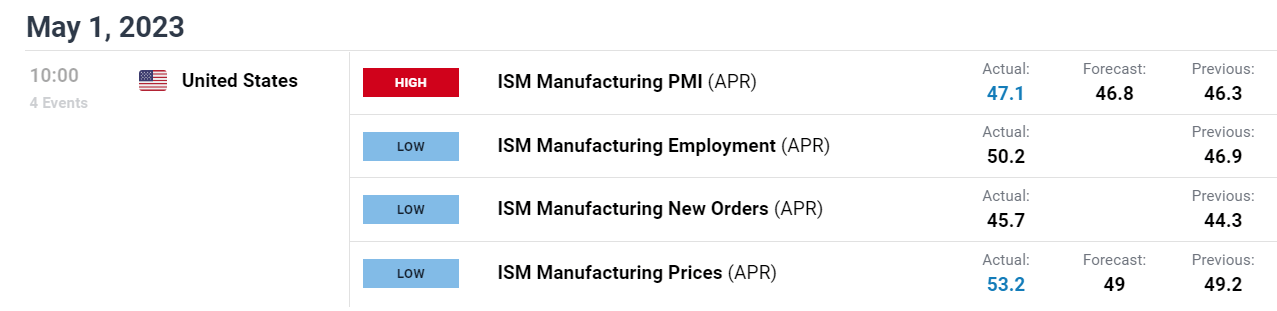
Source: DailyFX Economic Calendar
| Change in | Longs | Shorts | OI |
| Daily | -5% | 18% | 5% |
| Weekly | -13% | 9% | -4% |
The ISM survey’s results suggest that labor markets will remain tight in the near term, keeping wage pressures biased to the upside. The uptick in prices paid is also concerning insofar as it could signal a rebound in inflation on the horizon.
Against the current backdrop, the Fed may be deterred from suspending its tightening campaign soon. This means that further interest rate hikes beyond the one priced in for May should not yet be completely ruled out.
For a better understanding of the Fed’s roadmap, traders should closely follow the policymakers’ decision and outlook this week, when their May meeting concludes. In terms of expectations, the central bank is seen raising borrowing costs by a quarter point to 5.00-5.25% as part of its efforts to restore price stability, bringing the benchmark rate to its highest level in 17 years.
Recommended by Diego Colman
How to Trade Gold
With the 25 bp hike already discounted, the focus should be on guidance. If the Fed does not signal that it is stepping on the brakes imminently, yields could continue to rise, hurting precious metals and preventing them from resuming their recent rally. Conversely, if the Fed flags it is hitting the “pause button,” gold could bounce back quickly.
Focusing on XAU/USD technical analysis, resistance appears to be located near the $2,000 level. If bulls manage to push prices above this barrier decisively, we could see a move toward the 2023 highs soon. On further strength, attention shifts to $2,080, the all-time high. On the downside, initial support rests at $1,975. If this area is breached, the 50-day simple moving average could act as the next floor.
GOLD PRICES TECHNICAL CHART
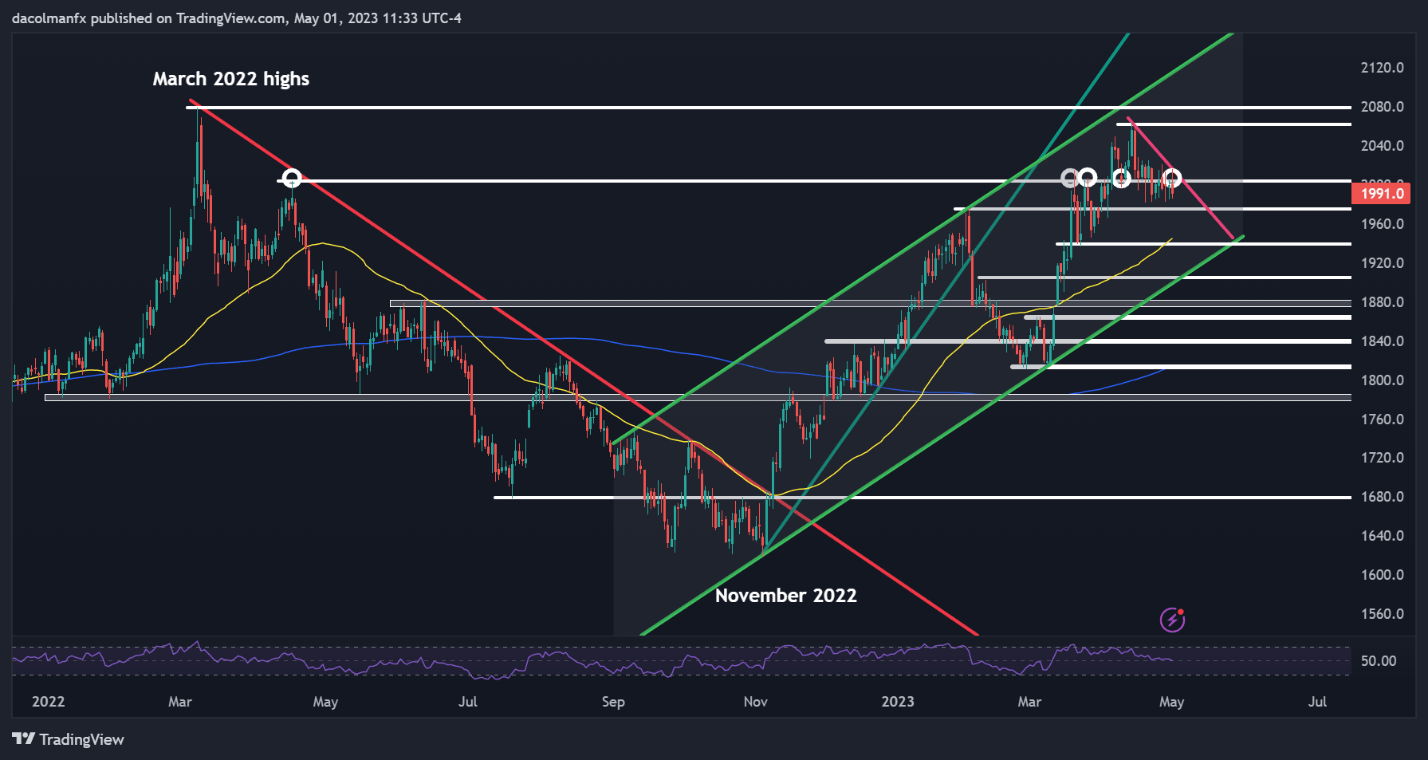
Gold Futures Technical Chart Prepared Using Trading View
element inside the
element. This is probably not what you meant to do!Load your application’s JavaScript bundle inside the element instead.
www.dailyfx.com