Gold broke above $2,000 last week on weaker US inflation numbers, but it retreated below this level and slipped to $1.970 on Wednesday, before bouncin
Gold broke above $2,000 last week on weaker US inflation numbers, but it retreated below this level and slipped to $1.970 on Wednesday, before bouncing back up and reaching a high of $2,012.44 yesterday. That came after the US Philly FED manufacturing index report which showed further deterioration, disappointing traders aftyer a surprisingly strong New York manufacturing report on Monday.
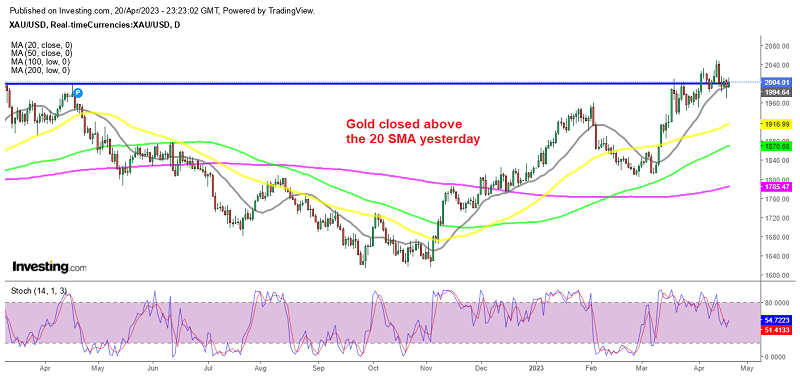
Although, at the end of the day XAU/USD increased by about 0.4% to $2,003. The price is consolidated after the spie higher and the retreat back down toward $2,000, as shown in the technical chart above. The state of the US economy and its impact on US yields are among the main factors which sent Gold prices higher yesterday.
The yield on the US 10-year note fell by 4 basis points to 3.55%, and back-month FED fund futures rallied strongly after a softer Beige Book report. This has resulted in a bullish correction in the price of gold as the US Dollar weakened, with the USD index DXY reversing down from a high of 102.126 to a low of 101.632.
Analysts have noted that gold prices have managed to avoid triggering CTA liquidations by holding above key trigger levels. Although retail demand for gold remains strong due to the recent banking liquidity crisis, interest could decline as prices rise.
Despite the drop in interest rates, discretionary traders remain largely flat, CTAs are near maximum long positions, and Shanghai trade positioning is near multi-year highs, leaving few culprits for the unexpected buying activity in the last session. Central bank demand remains crucial for a continued rally, and there are few signs of buyer fatigue.
GOLD pierced below the 20 SMA (gray) on the daily chart, which has also acted as support during late last year, as XAU was surging on declining USD. But, Gold didn’t close below the 20 SMA so this moving average is again acting as support on the daily chart and we might see a continuationfurther to the upside.
GOLD
www.fxleaders.com
