
Japanese Yen, USD/JPY, JGB, BoJ, Yield Curve Control - Talking PointsUSD/JPY made a 6.5-year high this week as market forces question policyThe Bank
Japanese Yen, USD/JPY, JGB, BoJ, Yield Curve Control – Talking Points
- USD/JPY made a 6.5-year high this week as market forces question policy
- The Bank of Japan has doubled down on maintaining low 10-year yields
- A lower JPY can help and hinder Japan. Will officials adopt a lower Yen policy?
The Yen continues to weaken Tuesday, as the Bank of Japan (BoJ) perseveres in buying 10-year Japanese Government Bonds (JGB).
The aim of the BoJ’s purchases is to an attempt to keep the yield at, or below, 0.25%. This yield curve control (YCC) is similar to the Reserve Banks of Australia’s YCC program that had to be abandoned in October last year due to overwhelming market forces.
The Bank of Japan have said that they will buy “whatever it takes” to maintain the yield at or below 0.25% through to March 31st. The central bank has said that they are aiming to stimulate the economy and are targeting a 2% year-on-year inflation rate.
Headline consumer inflation is currently 0.9%, while the core number is 0.6%. Annual producer price inflation is running at 9.3% and there is a concern that cost-push inflation is about to come down the pipe, which could lead to stagflation.
Stagflation being high and persistent inflation while growth remains subdued.
On the face of it, a weaker Yen can help to boost Japanese exporters as their products become cheaper to foreign buyers. On the downside, Japan is an importer of energy and these commodity prices have been going through the roof.
A weaker Yen only makes these commodities more expensive domestically for consumers and manufacturers.
The next meeting of the BoJ isn’t until the April 28th, and it appears that the market is going to test the resolve of the central bank in maintaining YCC.
USD/JPY – Technical Analysis
US/JPY broke above the November 2015 high of 123.755 but fell short of the August 2015 peak of 125.28 and the June 2015 high of 125.856. The latter 2 may offer resistance.
Monday’s peak of 125.108 might also offer resistance.
A bullish triple moving average (TMA) formation requires the price to be above the short term simple moving average (SMA), the latter to be above the medium term SMA and the medium term SMA to be above the long term SMA. All SMAs also need to have a positive gradient.
Given the recent parabolic moves in USD/JPY, all conditions for a TMA have been met using any combination short, medium and long-term SMAs.
Support could be at the 5-day SMA, currently at 122.614 or the pivot point at 118.551
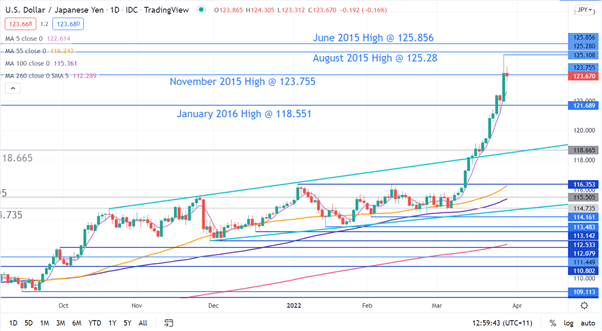
Chart created in TradingView
— Written by Daniel McCarthy, Strategist for DailyFX.com
To contact Daniel, use the comments section below or @DanMcCathyFX on Twitter
element inside the
element. This is probably not what you meant to do!Load your application’s JavaScript bundle inside the element instead.
www.dailyfx.com