
JAPANESE YEN PRICE, CHARTS AND ANALYSIS:Technicals on Yen Pairs Are Providing a Host of Technical Setups.EUR/JPY Eyeing Trendline Bounce or Break with
JAPANESE YEN PRICE, CHARTS AND ANALYSIS:
- Technicals on Yen Pairs Are Providing a Host of Technical Setups.
- EUR/JPY Eyeing Trendline Bounce or Break with 8-Year Highs in Sight.
- USD/JPY Rising Wedge Pattern in Focus.
- AUD/JPY H4 Timeframe Sees RSI Enter Oversold Territory.
Recommended by Zain Vawda
Get Your Free JPY Forecast
JAPANESE YEN BACKDROP
Japanese Yen caught a bid on Tuesday as sentiment suffered a slight lull following disclosures by First Republic Bank after market close on Monday in the US. Fears of a further selloff in banking stocks resurfaced following an already cautious mood ahead of US companies’ earnings and data out this week.
The new BoJ Governor issued comments overnight and so did the Japanese Finance Minister Shunichi Suzuki who said the BoJ would act if inflation and wage growth continue to rise by raising rates. Governor Ueda meanwhile reiterated the importance of keeping Japan’s monetary policy loose to achieve the 2% inflation target in a sustainable and stable manner, along with wage hikes. The Governor went s step further saying that the risk to Japan is inflation undershooting forecasts rather than overshooting.
Despite the mixed nature of the comments and helped by the aforementioned fears around a return of a bank sector selloff the Yen is enjoying a relatively good day thus far, trading higher against the Euro, Dollar and the Aussie Dollar.
Trade Smarter – Sign up for the DailyFX Newsletter
Receive timely and compelling market commentary from the DailyFX team
Subscribe to Newsletter
PRICE ACTION AND POTENTIAL SETUPS
EURJPY
EUR/JPY Daily Chart
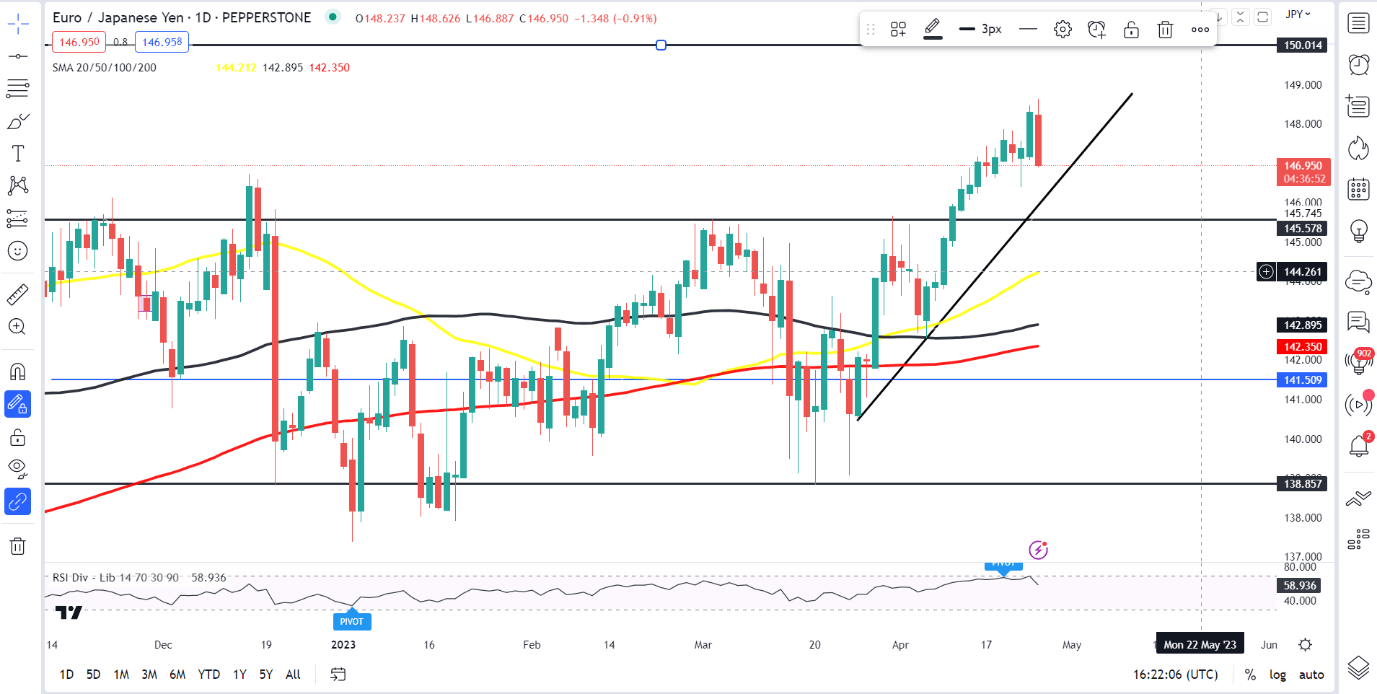
Source: TradingView, prepared by Zain Vawda
EURJPY has been on a tear of late rallying close to 1000 pips since March 24. We stopped short of the psychological 150.00 mark which ironically is the same number where USDJPY found significant resistance as well.
Today however EURJPY appears to set to close as a bearish engulfing candle on the daily timeframe. We do have the steep ascending trendline likely to provide dynamic support around the 146.00-146.50 mark. A break below the trendline could provide a short-term push toward the moving averages with the 50-day MA around the 144.00 handle. Overall EURJPY remains bullish unless we have a daily candle close below the 143.00 level so any short positions are counter trend in nature and would require tight risk management.
Alternatively, a bounce of the trendline could see the start of the next leg higher with the 150.00 psychological level in sight, an 8-year high.
USDJPY
USD/JPY Daily Chart
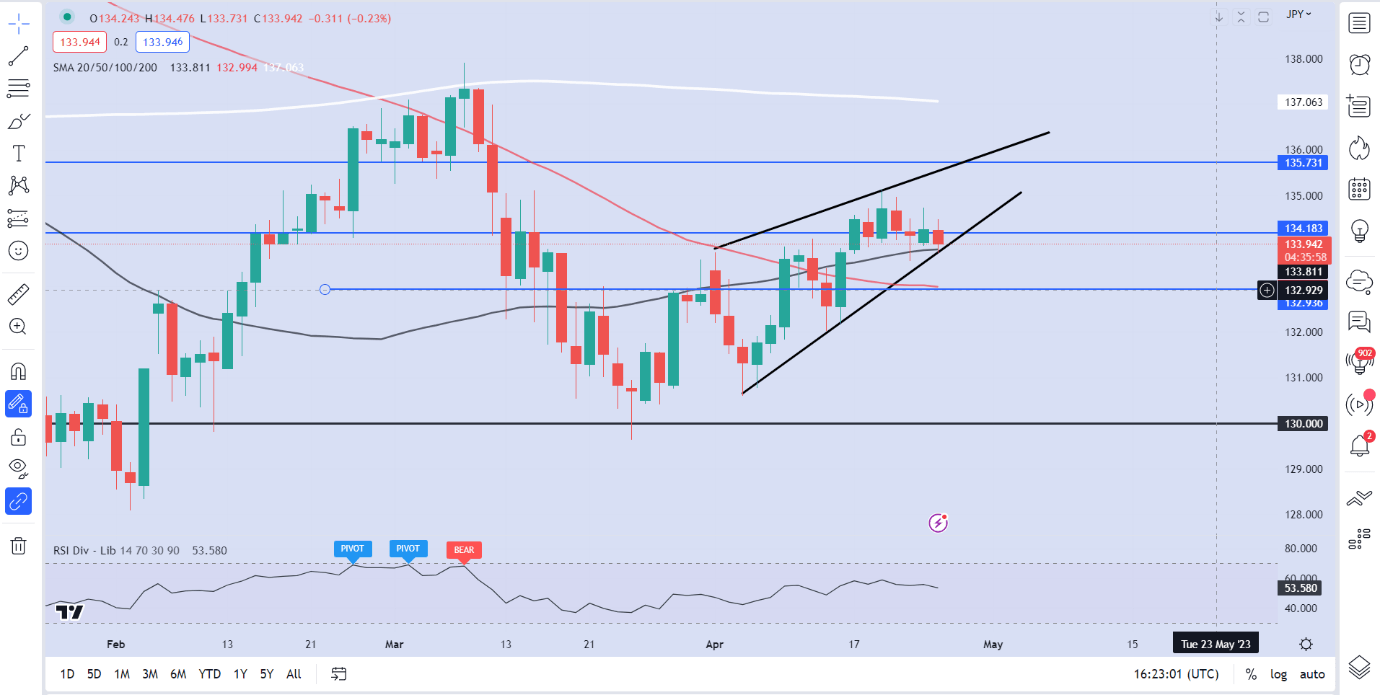
Source: TradingView, prepared by Zain Vawda
From a technical perspective, the daily chart for USD/JPY gives some idea as to the lull we have been witnessing on the pair of late. We have been trading sideways for the last trading days but have just tapped the lower end of the ascending wedge pattern in play. Price is currently being supported by the 50-day MA and the 100-day MA which rests at around the 133.00 handle.
A break and daily candle close below the wedge patter opens up support levels around the 132.00 and 130.700 areas respectively. Of course, bears will have to navigate their way past initial barriers of support provided by the 50 and 100-day MAs. Bullish structure remains intact without a daily candle close below the 132.50 mark.
AUDJPY
AUD/JPY H4 Chart
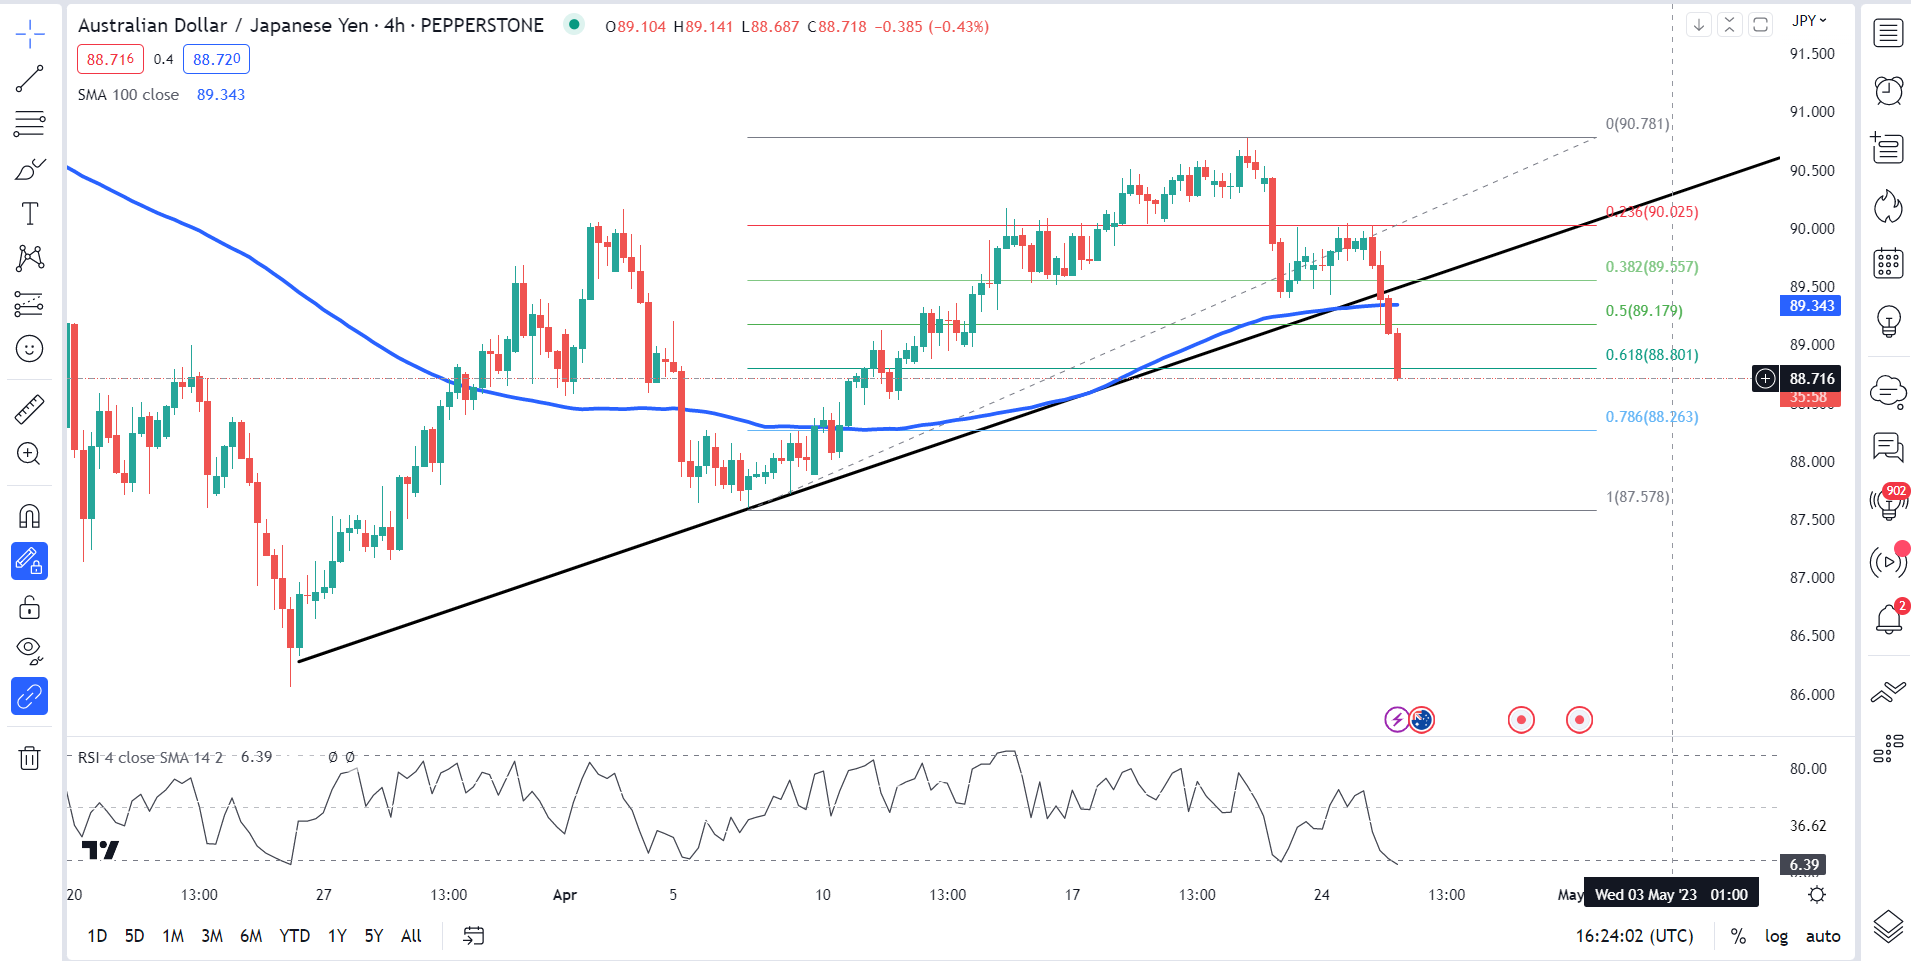
Source: TradingView, prepared by Zain Vawda
The AUD/JPY H4 chart looks eerily similar to EURJPY with the notable exception being that the AUDJPY chart has seen a clean break of the ascending trendline. The pair remains bullish overall on the H4 timeframe as the previous higher low swing point around 87.500 continues to hold. A break below this level would invalidate my current bullish bias on the pair.
Based on overall structure we are currently trading in an excellent discount area between the 61.8% and 78.6% levels of the fib retracement tool while the RSI is in oversold territory as well. This provides a decent setup for upside continuation as you would be following the overall trend as well with upside resistance resting around the 89.40 and 90.00 respectively.
Introduction to Technical Analysis
Moving Averages
Recommended by Zain Vawda
Resources For Traders
Whether you are a new or experienced trader, we have several resources available to help you; indicators for tracking trader sentiment, quarterly trading forecasts, analytical and educational webinars held daily, trading guides to help you improve trading performance, and one specifically for those who are new to forex.
— Written by Zain Vawda for DailyFX.com
Contact and follow Zain on Twitter: @zvawda
element inside the
element. This is probably not what you meant to do!Load your application’s JavaScript bundle inside the element instead.
www.dailyfx.com