
Japanese Yen, USD/JPY, Crude Oil, WTI, Brent, PMI, ECB, Fed - Talking PointsThe Japanese Yen resumed its march lower, uninterrupted APAC equities wer
Japanese Yen, USD/JPY, Crude Oil, WTI, Brent, PMI, ECB, Fed – Talking Points
- The Japanese Yen resumed its march lower, uninterrupted
- APAC equities were mixed in a relatively quiet session
- A series of PMIs lie ahead before US non-farm payrolls
The Japanese Yen weakened again today but other G-10 currencies are little-changed. In the absence of any commentary/jawboning from Bank of Japan (BOJ) officials, it was left to its own devices.
Japan’s Jibun Bank PMI was an improvement on last month, coming in at 54.1, while China’s Caixin PMI disappointed expectations, printing at 48.1.
APAC equity markets were quiet after Wall Street closed over 1.5% lower across the three main indices there. Hong Kong and Japan were down a bit, Chinese mainland was up a bit, and the Australian share market finished flat going into the weekend.
Crude oil is looking a bit vulnerable with the WTI futures contract sliding under US$ 100 bbl. The Brent contract is around US$ 104.50. Gold has held its ground, trading near US$ 1,937 an ounce.
Government bond yields are slightly higher in Asia, with the benchmark 10-year Treasury note inching up toward 2.4%. The closely watched 2-10’s part of that curve briefly dipped negative and remains close to inversion at 0.005%.
After European PMIs and the aggregate Eurozone CPI number, the US will see non-farm payrolls data for March, with forecasts of 490k jobs added, according to a Bloomberg survey. Later on, US and Canadian PMIs will be released, followed by the US manufacturing ISM report.
A number of ECB and Fed speakers will be crossing the wires as well.
The full economic calendar can be viewed here.
USD/JPY Technical Analysis
USD/JPY kicked off the week with a meteoric rise to its highest level since 2015.
The high of 125.108 fell just short of the August 2015 and June 2015 peaks of 125.28 and 125.86 respectively. These levels may continue to offer resistance.
The explosion in volatility can be seen in the width of the 21-day simple moving average (SMA) basedBollinger Band that expanded dramatically on the move.
It has since moved back inside the band and initially tested support at the 10-day SMA at 121.317, which held. That level might provide support if tested again.
Not surprisingly, all short, medium and long-term SMAs are pointing toward bullish momentum. A sustained move below the 10-day SMA might provide a clue if that momentum is to stall.
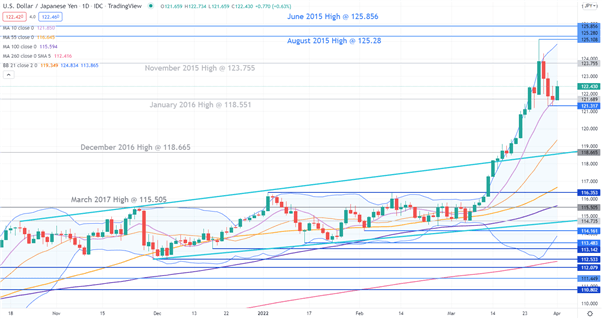
Chart created in TradingView
— Written by Daniel McCarthy, Strategist for DailyFX.com
To contact Daniel, use the comments section below or @DanMcCathyFX on Twitter
element inside the
element. This is probably not what you meant to do!Load your application’s JavaScript bundle inside the element instead.
www.dailyfx.com