
RAND ANALYSISInflation target concerns.Exports boost current account balance surplus.Poor South African manufacturing for July.U.S. initial jobles
RAND ANALYSIS
- Inflation target concerns.
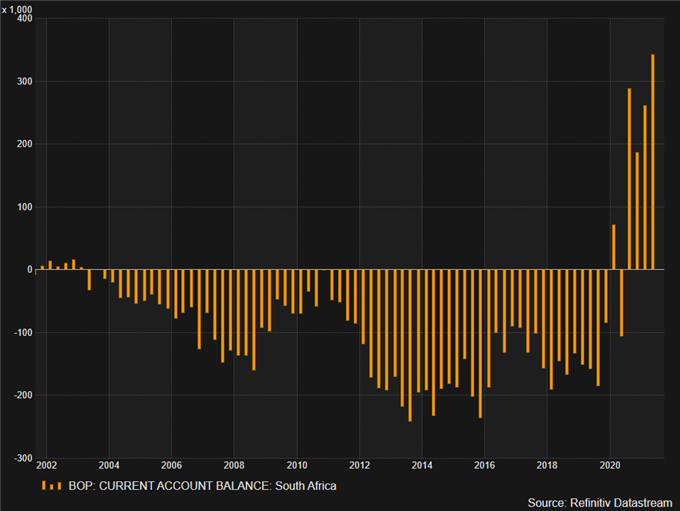
- Exports boost current account balance surplus.
- Poor South African manufacturing for July.
- U.S. initial jobless claims beats estimates.
- 14.0000 on the horizon.
ZAR FUNDAMENTAL BACKDROP
GET YOUR Q3 RAND FORECAST HERE!
POTENTIAL FOR INFLATION TARGETING REVISIONS
The South African rand has experienced a rollercoaster ride this week sparked by an address by the South African Reserve Bank (SARB) Governor Lesetja Kganyago at Stellenbosch university. In his speech he raised concerns around inflation targeting which he believed should be lowered from the current 3% – 6% to 3% – 4%. A few key excerpts from his speech include:
“if we want to keep interest rates low, the most important thing we can do is to lower the inflation target.”
“As I have argued previously, a more appropriate target would be a point target of around 3% or 4%, putting us in the same territory as our peers.”
ECONOMIC DATA FAVORS USD DESPITE RECORD CURRENT ACCOUNT SURPLUS
The day opened up with positive news for ZAR bulls as the current account surplus reached historical highs (see graphic below) which exceeded analyst forecasts.
Soon after, manufacturing data (refer to graphics below) printed poorly and missed both MoM and YoY estimates. This quickly stemmed the rallying rand which was further provoked by the initial jobless claims announcement – a major point of interest for the Federal Reserve. This evening (SA time), Fed speeches from Bowman and Williams respectively may add more colour to the taper situation especially after better than expected jobs data earlier today.
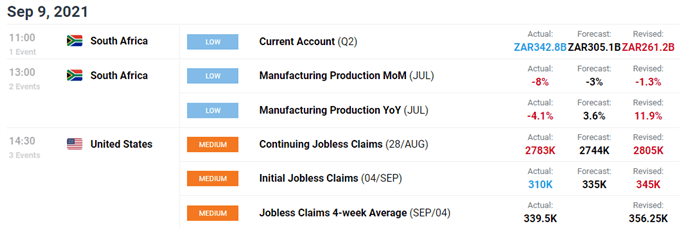
Source: DailyFX economic calendar
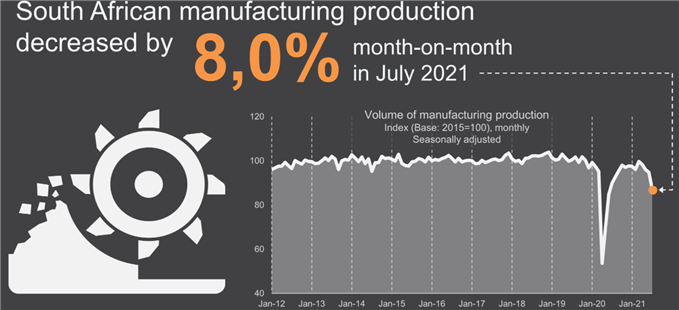
Source: StatsSA
Major rand linked commodities (iron ore, platinum and spot gold) have been fading but the Emerging Market (EM) currency continued to appreciate against the U.S. dollar as the carry trade (higher yielding rand) took center stage.
TECHNICAL ANALYSIS
USD/ZAR DAILY CHART
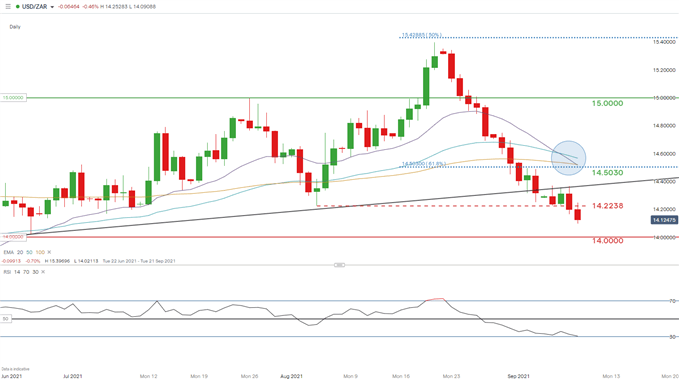
Chart prepared by Warren Venketas, IG
Technical analysis on the daily USD/ZAR chart above illustrates significant breaks in key levels along with bearish inclinations on certain indicators. The Exponential Moving Average (EMA) bearish crossover (as mentioned in my previous article) has unfolded with the threat of another bearish cross looming – 50-day EMA crossing below 100-day EMA (blue). There is room for the 14.0000 psychological handle to come into play so caution should be exercised for bulls looking to enter the market at this point.
Oversold signals on the Relative Strength Index (RSI) are fast approaching which could coincide with price action reaching the 14.0000 level. This level could see some profit taking and may incentivize long entries.
Resistance levels:
- 14.5030 – 61.8% Fibonacci level
- Trendline support (black)
- 14.2238 – August swing low
Support levels:
— Written by Warren Venketas for DailyFX.com
Contact and follow Warren on Twitter: @WVenketas
element inside the
element. This is probably not what you meant to do!Load your application’s JavaScript bundle inside the element instead.
www.dailyfx.com