
NASDAQ 100 OUTLOOK:Nasdaq 100 plunges more than 2% as soaring U.S. inflation strengthens the argument for forceful monetary tightening Fed speak sugg
NASDAQ 100 OUTLOOK:
- Nasdaq 100 plunges more than 2% as soaring U.S. inflation strengthens the argument for forceful monetary tightening
- Fed speak suggests that the central banks may be leaning towards a 50bp interest rate hike at its March meeting, with James Bullard indirectly endorsing that scenario
- The prospect of aggressive monetary policy will spur near-term volatility, increasing downside risks for the more speculative and expensive segments of the market
Most recent: S&P Pulls Back, USD Resistance Test, 10 Year to 2% on Massive Inflation Print
It was a turbulent day on Wall Street following the release of last month’s inflation data. According to the Bureau of Labor Statistics, January CPI increased 7.5% y/y, its highest reading since February 1982 and slightly ahead of consensus forecast of 7.3% y/y. Core inflation also accelerated, rising to 6% y/y from December’s 5.7%, a sign that price pressures are broadening in the economy and that the underlying trend is deteriorating.
The results drove Treasury rates up across the curve, increasing the likelihood of a super-sized March Fed hike and pushing the 10-year yield above the 2% mark for the first time since August 2019. Naturally, equities took a sharp turn to the downside, with the S&P 500 tumbling 1.81% to 4,504 and the Nasdaq 100 plummeting 2.33% to 14,705 at the closing bell.
With sentiment on shaky footing, the road ahead for stocks will be rocky, especially for those with exorbitant multiples in the tech and growth universe. Soaring inflationary forces will nudge the Fed to withdraw stimulus vigorously in the coming months, pulling liquidity out of the system and creating a less benign environment for speculation.
Tightening into an overvalued market at a time of slowing economic activity is recipe for volatility, so it would be difficult for risk appetite to pick up steadily in this kind of setting. Of course, the historical playbook suggests that a hawkish central bank should not be a reason jump ship and liquidate portfolios, but it may be a good time to keep some dry powder on the sidelines to take advantage of more attractive opportunities that may present themselves later in the year.
With the earnings season winding down in the next couple of weeks, investors’ attention will turn to incoming economic data and central bank policy outlook. Having said that, analysts believe the FOMC will begin raising borrowing costs next month, but expectations on the magnitude of the first adjustment are divided, with some anticipating a 25bp move and others betting on a 50bs increase.
Today, in an interview with Bloomberg News, St. Louis Fed President and voting member James Bullard stated that he favors starting balance sheet reduction in the second quarter and that he’d like to see 100bp in tightening in the bag by July 1, spreading rate increases over the next three meetings, a condition that effectively opens the door to a half-percentage point hike next month. Within minutes, Bullard’s view became the baseline scenario, with the CME FedWatch Tool assigning a 92% probability to a 50bp hike in March amid signs policymakers are beginning to lean toward more forceful measures to quell inflation.
The prospect of increasingly aggressive monetary policy brings equity duration risks and may weigh on the Nasdaq 100 this month, capping its near-term upside and leading traders to sell any rallies for fear that gains may not be sustained.This doesn’t mean there aren’t good opportunities, just that investors need to be more selective. That said, value companies with solid fundamentals, strong pricing power, undemanding valuations, high profit margins and attractive free cash flows, such as those in the energy sector, may continue to command strengthin the near term, even in the face of the Fed’s normalization cycle.
NASDAQ 100 TECHNICAL OUTLOOK
After a powerful rally on Wednesday, the Nasdaq 100 briefly tested its 200-day simple moving average near the 15,050, but failed to clear this barrier as sellers resurfaced to push the price lower during Thursday’s trading session, a sign that bears remain in control of the market. If the tech index continues on the downward trajectory, technical support lies at 14,430, but a move below this floor could fuel a large selloff, paving the way for a pullback towards 13,840.
On the flip side, if Thursday’s decline proves transitory and the Nasdaq 100 pivots higher and reclaims its 200-day SMA decisively in the days ahead, the benchmark could attack Fibonacci resistance at 15,256. If this ceiling is breached, the 15,616 area would become the immediate upside focus
NASDAQ 100 TECHNICHAL CHART
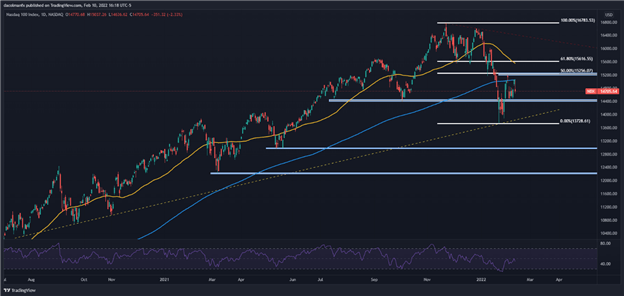
Nasdaq 100 (NDX) chart prepared in TradingView
EDUCATION TOOLS FOR TRADERS
- Are you just getting started? Download the beginners’ guide for FX traders
- Would you like to know more about your trading personality? Take the DailyFX quiz and find out
- IG’s client positioning data provides valuable information on market sentiment. Get your free guide on how to use this powerful trading indicator here.
—Written by Diego Colman, Contributor
element inside the
element. This is probably not what you meant to do!Load your application’s JavaScript bundle inside the element instead.
www.dailyfx.com