


KOSPI Composite Index, NIFTY 50 Index, South Korea, India – Technical Outlook:
- KOSPI is at risk of some more weakness.
- Nifty’s three-month-long uptrend could be stalling.
- What is the outlook and what are the key levels to watch?
Recommended by DailyFX
Get Your Free Equities Forecast
KOSPI TECHNICAL FORECAST – BEARISH
A retreat from tough resistance and the subsequent break below key support point to further weakness in South Korea’s KOSPI Composite index.
The index mid-August pulled back from key resistance on the 89-day moving average (DMA) for the third time in nine months. Furthermore, the break early September below a horizontal trendline support at 2,432 confirms that the downtrend has resumed. Similar retreats from the 89-DMA followed by bearish breaks in January and June led to increased downward momentum as bears gained control (as reflected in the strength in minus Directional Movement Index; see chart).
The subsequent decline in the previous two episodes was around 11%. While history may not repeat, there’s a growing risk of KOSPI at least retesting the July low of 2,277 (although 11% decline from 2,432 would point to a move towards 2,165). On the upside, the index needs to break above the August high of 2,546, roughly coinciding with the 89-DMA, for the downward pressure to ease.
Recommended by DailyFX
The Fundamentals of Trend Trading
KOSPI COMPOSITE INDEX – Daily Chart
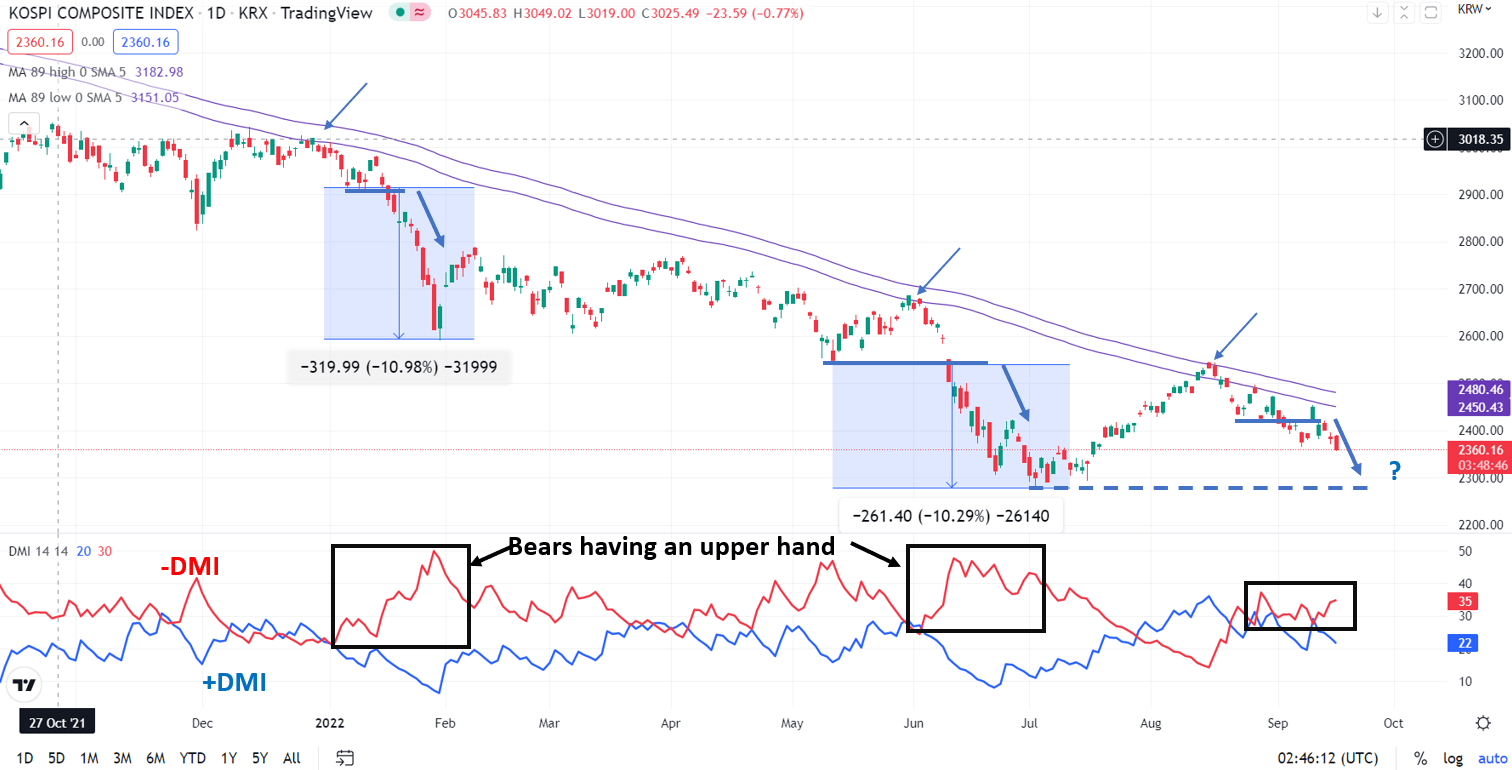

Chart Created Using TradingView
NIFTY 50 TECHNICAL FORECAST – NEUTRAL
A bearish Engulfing pattern on the weekly candlestick chart of India’s NIFTY 50 index at near key resistance is a sign that the three-month-long upward momentum could be fading. The index could be settling in a range in the short term.
NIFTY made a new five-month high last week but couldn’t sustain gains towards the latter part of the week. In the process, the index posted a bearish reversal pattern on the weekly chart. The retreat occurred from stiff resistance defined by a horizontal trendline from April at 18,100. This follows a similar bearish reversal pattern (an Evening Star candlestick formation) at the resistance a month ago. Back-to-back rejection at higher levels is a sign that bulls have had to take a back seat for the time being.
On the daily chart, last week’s high was associated with negative divergence (rising index levels associated with weakening momentum; see chart). The index is now testing key support on an internal uptrend line within a rising channel from March. A break below the trendline would imply that the index had shifted to a ‘lower gear’ within the rising channel. Such a break would move focus to crucial support the end-August low at 17,166 (also the neckline of a minor double top pattern). Only a break below 17,166 would suggest that the multi-week uptrend was at risk.
Recommended by DailyFX
The Fundamentals of Range Trading
NIFTY 50 INDEX Daily Chart
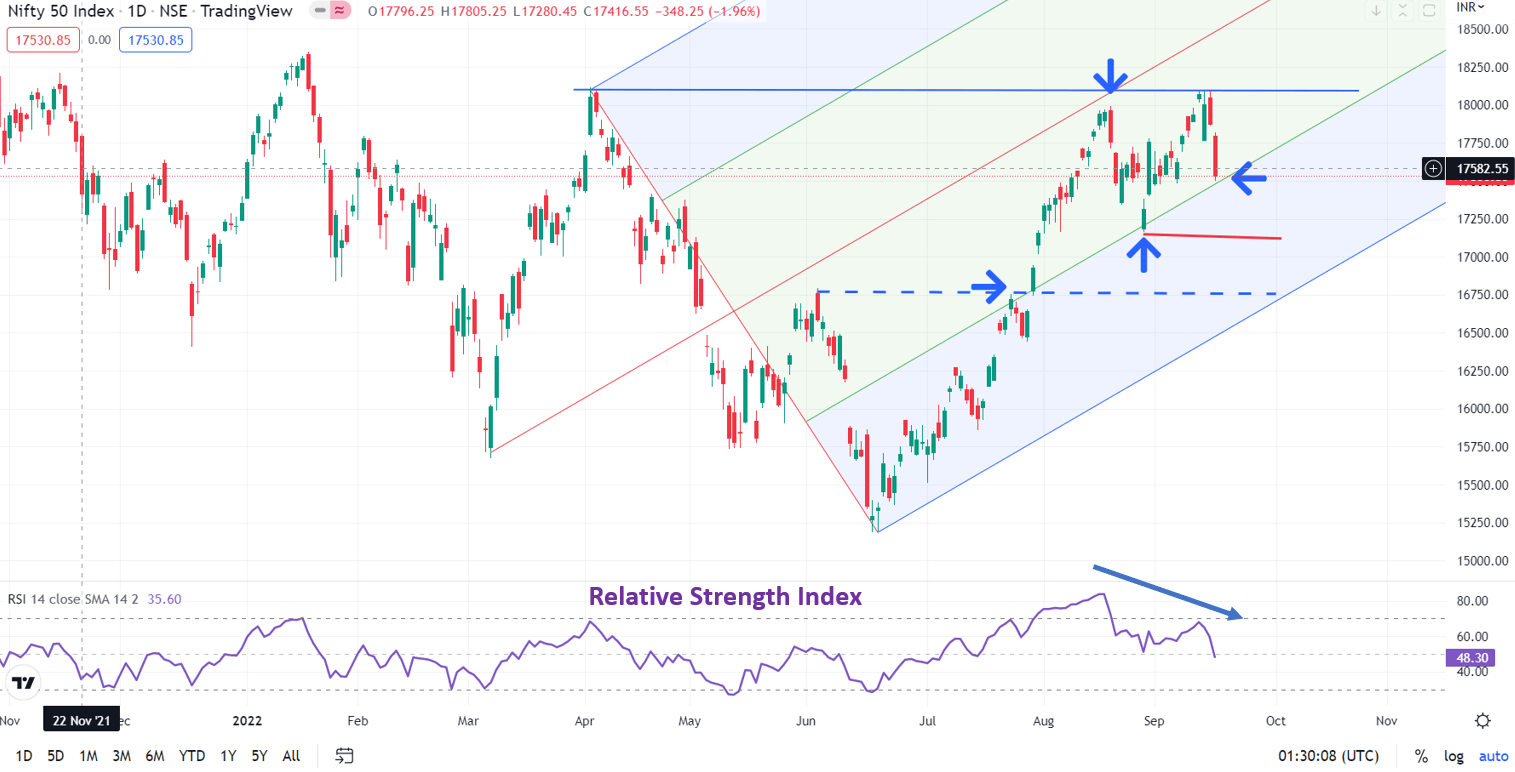

Chart Created Using TradingView
— Written by Manish Jaradi, Strategist for DailyFX.com
element inside the
element. This is probably not what you meant to do!Load your application’s JavaScript bundle inside the element instead.
www.dailyfx.com