
New Zealand Dollar Talking PointsNZD/USD appears to be trading within bull flag formation as it tracks the monthly opening range for September, an
New Zealand Dollar Talking Points
NZD/USD appears to be trading within bull flag formation as it tracks the monthly opening range for September, and the update to New Zealand’s Gross Domestic Product (GDP) report may trigger a bullish reaction in the New Zealand Dollar as the economy is expected to grow at a record pace.
NZD/USD Bull Flag Formation Emerges Amid Failure to Test Monthly High
NZD/USD trades in a narrow range following the failed attempt to test the monthly high (0.7170), and the exchange rate may continue to consolidate over the remainder of the week as it gives back the advance following the larger-than-expected slowdown in the US Consumer Price Index (CPI).
It remains to be seen if New Zealand’s GDP report will influence the near-term outlook for NZD/USD as the growth rate is expected to 16.3% in the second quarter of 2021, which would mark the highest reading since the series began in 1987, but signs of a robust recovery may put pressure on the Reserve Bank of New Zealand (RBNZ) to normalize monetary policy sooner rather than later as Assistant Governor Christian Hawkesby revealed that “a 50 basis point move was definitely on the table” at the August meeting.
As a result, an upbeat GDP report may fuel speculation for an imminent shift in RBNZ policy with only two more meetings left for the remainder of the year, but a further appreciation in NZD/USD may fuel the tilt in retail sentiment like the behavior seen earlier this year.
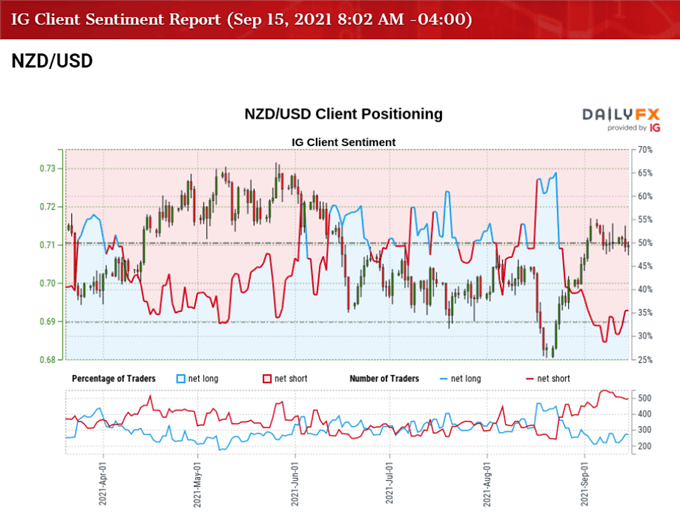
The IG Client Sentiment report shows 35.19% of traders are currently net-long NZD/USD, with the ratio of traders short to long standing at 1.84 to 1.
The number of traders net-long is 1.77% lower than yesterday and 19.31% higher from last week, while the number of traders net-short is 5.19% lower than yesterday and 8.08% lower from last week. The rise in net-long position comes as NZD/USD trades within the monthly opening range for September, while the decline in net-short interest has done little to alleviate the crowding behavior as 36.38% of traders were net-long the pair last week.
With that said, the update to New Zealand’s GDP report may sway the near-term outlook for NZD/USD as the RBNZ prepares to switch gears, and the exchange rate may stage a larger recovery over the remainder of the month as a bull flag formation takes shape.
NZD/USD Rate Daily Chart
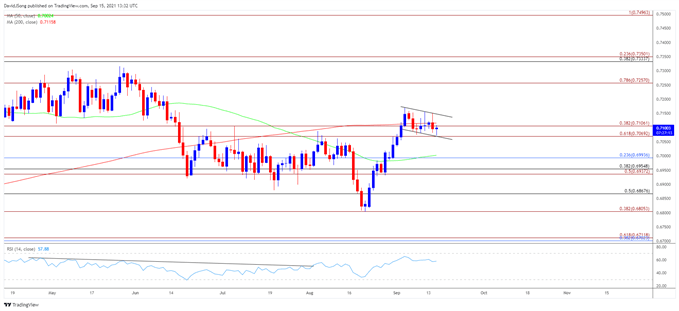
Source: Trading View
- Keep in mind, a head-and-shoulders formation materialized in the first quarter of 2021 as NZD/USD slipped below the 50-Day SMA (0.7002) for the first time since November, with the exchange rate pushing below the 200-Day SMA (0.7115) for the first time since June 2020 to trade to a fresh yearly low (0.6805) in August.
- However, NZD/USD has reversed course ahead of the November 2020 low (0.6589) amid the failed attempt to close below the 0.6810 (38.2% expansion) region, and it remains to be seen if the advance from the August low (0.6805) will turn out to be a correction in the broader trend as a bull flag formation takes shape.
- In turn, NZD/USD may continue to defend the opening range for September as it holds above the Fibonacci overlap around 0.7070 (61.8% expansion) to 0.7110 (38.2% expansion), but a break of the monthly high (0.7170) may open up the 0.7260 (78.6% expansion) as the continuation pattern comes into play.
- A break above the June high (0.7288) brings the 0.7330 (38.2% retracement) to 0.7350 (23.6% expansion) area on the radar, with the next region of interest coming in around the 0.7500 (100% expansion) handle.
- However, failure to hold above the Fibonacci overlap around 0.7070 (61.8% expansion) to 0.7110 (38.2% expansion) may push NZD/USD back towards the 0.6990 (23.6% retracement) region, with the next area of interest coming in around 0.6940 (50% expansion) to 0.6960 (38.2% retracement).
— Written by David Song, Currency Strategist
Follow me on Twitter at @DavidJSong
element inside the
element. This is probably not what you meant to do!Load your application’s JavaScript bundle inside the element instead.
www.dailyfx.com