
The S&P 500 Index recently reached a record high of 5,539.27, marking a 0.51% increase largely driven by significant gains in the technology sect

Economic Indicators and Their Impact on Markets
Despite softer economic indicators, such as the ADP’s private payroll growth and a contraction in the ISM Services PMI, market sentiment has remained robust.
Meanwhile, the ISM Services PMI dropped to 48.8, its lowest since April 2020. Normally, such data might dampen market enthusiasm, but the current climate reflects a different trend.
A declining bond yield has bolstered this optimism, with traders speculating that these developments could prompt the Federal Reserve to cut interest rates sooner.
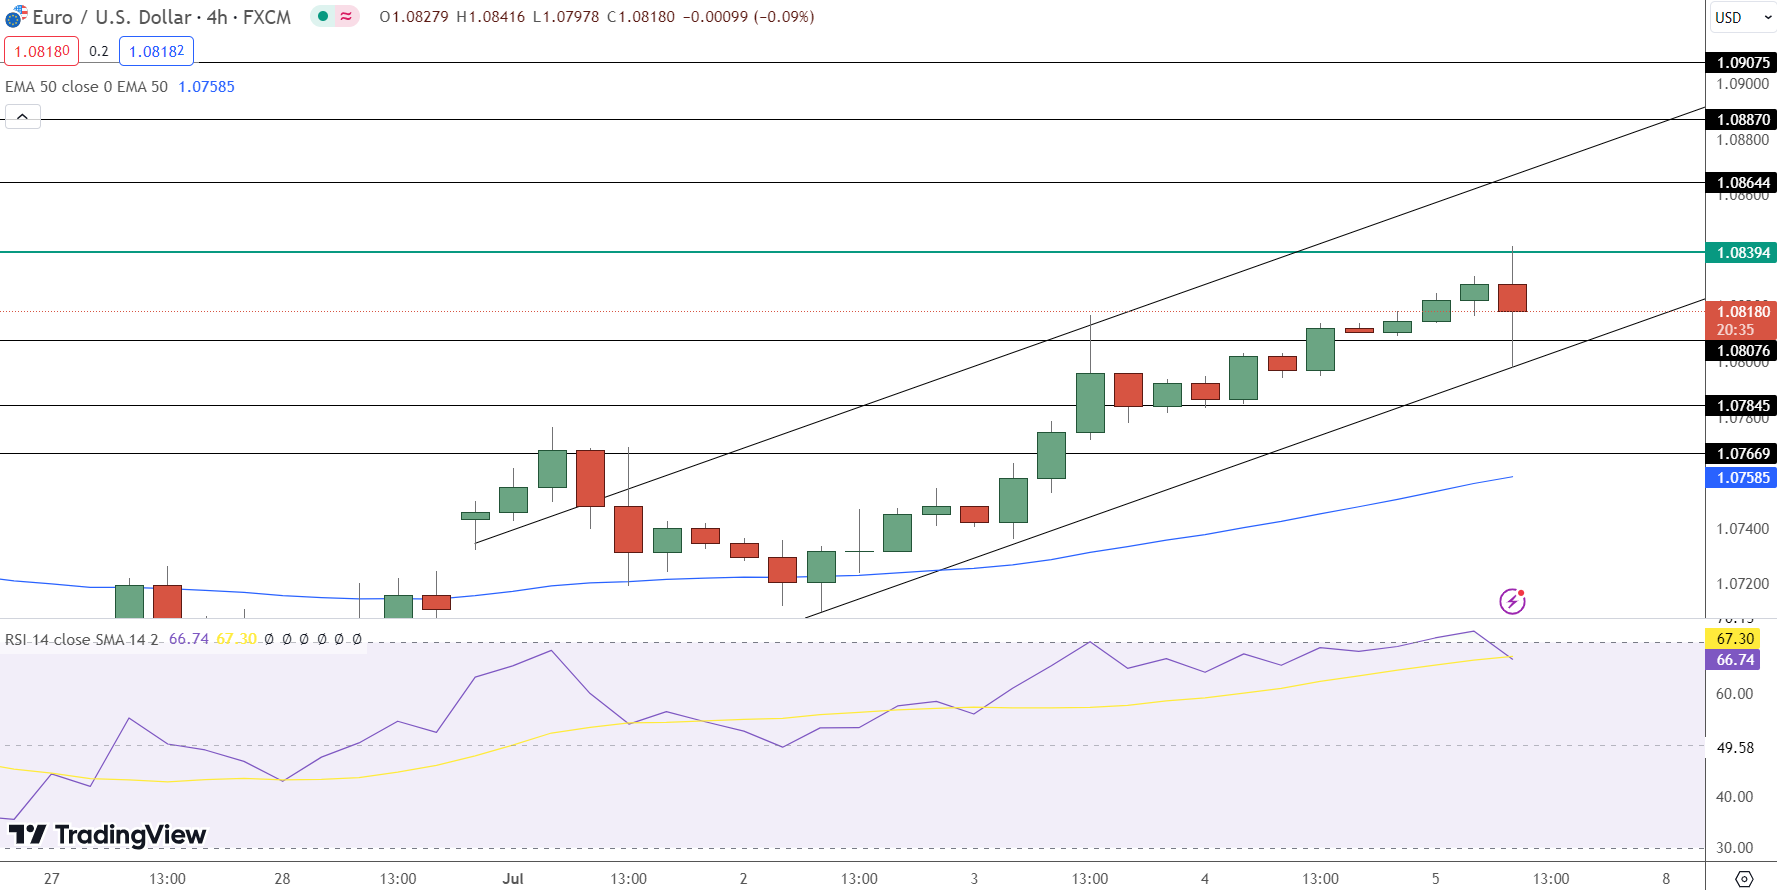
A weaker US dollar, which has been declining for four consecutive days to its lowest level in over three weeks, supports this view. The potential for lower interest rates generally reduces the appeal of the dollar, boosts US exports’ competitiveness, and enhances earnings for multinational corporations.
Looking Ahead: Nonfarm Payrolls and the Federal Reserve’s Next Moves
All eyes are now on the forthcoming Nonfarm Payrolls report, expected to show an addition of 190,000 jobs in June. The stability of the unemployment rate at 4% suggests ongoing labour market strength.
However, any signs of weakening in the Average Hourly Earnings growth, anticipated to slow down this month, could provide critical insights into the broader economic health and influence the Fed’s upcoming decisions.
Investors and analysts alike are keenly observing these developments to gauge potential shifts in monetary policy, which could have lasting impacts on the financial markets.
S&P 500 Technical Analysis and Forecast
- Current Trading Level: The S&P 500 is trading at $5537.01, reflecting a 0.51% increase.
- Key Resistance Levels: Immediate resistance is at $5544.17, followed by $5556.37 and $5569.74.
- Key Support Levels: Support can be found at $5507.19, $5494.59, and $5475.71.
- Market Sentiment Indicators: The Relative Strength Index (RSI) at 72 indicates the index may be approaching overbought territory, suggesting potential for a future pullback.
- 50-Day EMA: Positioned at $5472.05, it acts as a dynamic support, reinforcing the bullish trend.
As the market navigates through these economic indicators and potential shifts in monetary policy, the strategic positioning within the S&P 500 will be crucial for investors looking to capitalize on the ongoing trends and adjust to the ever-evolving market landscape.
www.fxleaders.com