
Recommended by Richard Snow Improve your trading with IG Client Sentiment Data AUD/USDAUD/USD: Retail trading statistics indic
Recommended by Richard Snow
Improve your trading with IG Client Sentiment Data
AUD/USD
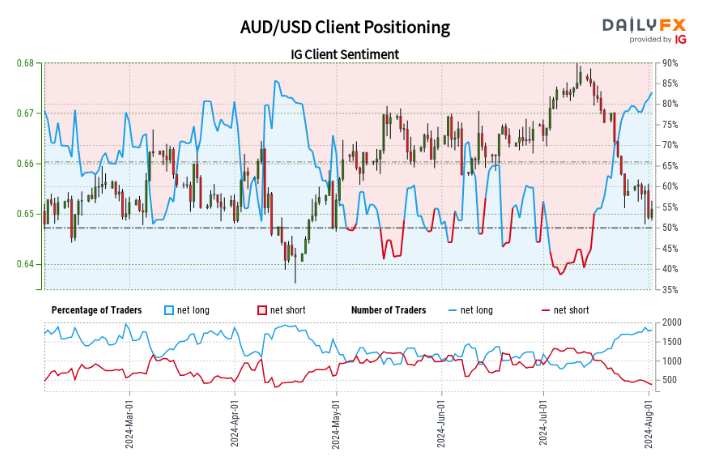
AUD/USD: Retail trading statistics indicate 81.92% of participants hold long positions, with a long-to-short ratio of 4.53:1. Long positions have increased by 2.53% daily and 6.08% weekly, while short positions have decreased by 10.24% daily and 16.94% weekly.
Adopting a contrarian approach to market sentiment suggests potential downward pressure on AUD/USD prices. The increased net-long positioning compared to yesterday and last week reinforces our bearish outlook for AUD/USD.
AUD/USD Daily Chart
Source: TradingView, prepared by Richard Snow
Oil – US Crude
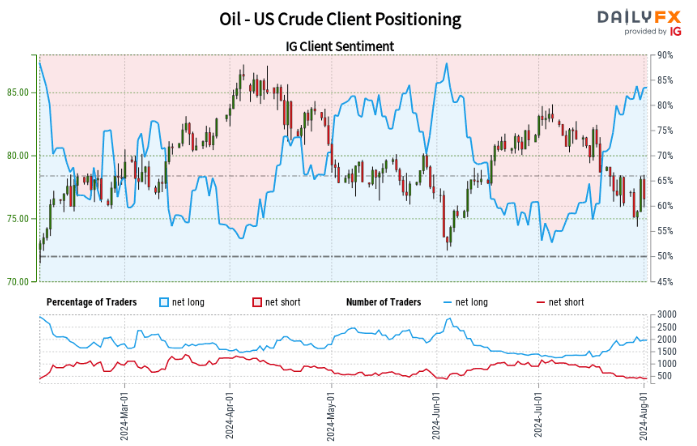
Oil – WTI: Market data reveals 83.60% of retail traders are long, with a 5.10:1 long-to-short ratio. Long positions have grown by 4.58% daily and 14.48% weekly, while short positions have declined by 19.26% daily and 20.72% weekly.
When adopting a contrarian stance on market sentiment, the predominance of long positions implies a potential decline in Oil – US Crude prices. The increase in net-long positions over both daily and weekly timeframes strengthens the bearish perspective.
Oil (WTI) Daily Chart
Source: TradingView, prepared by Richard Snow
S&P 500
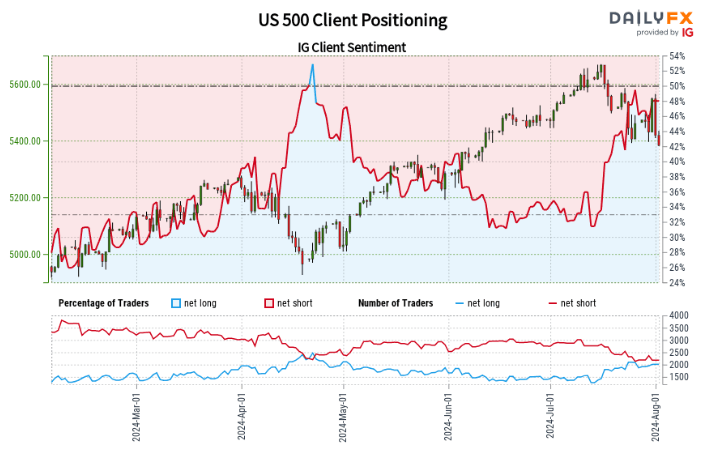
US 500: Retail trading figures show 47.75% of traders are long, with a short-to-long ratio of 1.09:1. Long positions have increased by 8.13% daily but decreased by 6.47% weekly. Short positions have fallen by 10.11% daily but risen by 2.17% weekly.
Our contrarian approach to market sentiment suggests the prevalence of short positions may lead to continued price appreciation in the US 500. However, the mixed positioning changes across different timeframes result in a more nuanced, mixed trading outlook.
S&P 500 Daily Chart
Source: TradingView, prepared by Richard Snow
Recommended by Richard Snow
Get Your Free Equities Forecast
— Written by Richard Snow for DailyFX.com
Contact and follow Richard on Twitter: @RichardSnowFX
element inside the
element. This is probably not what you meant to do!Load your application’s JavaScript bundle inside the element instead.
www.dailyfx.com