
Number of traders net-short has increased by 26.47% from last week. SYMBOL TRADING BIAS NET-LONG% NET-SHORT% CHANGE IN LONGS CHANGE IN SHORTS
Number of traders net-short has increased by 26.47% from last week.
|
SYMBOL |
TRADING BIAS |
NET-LONG% |
NET-SHORT% |
CHANGE IN LONGS |
CHANGE IN SHORTS |
CHANGE IN OI |
|
FTSE 100 |
BULLISH |
28.88% |
71.12% |
-29.24%
-35.61% |
25.20%
26.47% |
2.44%
-1.07% |
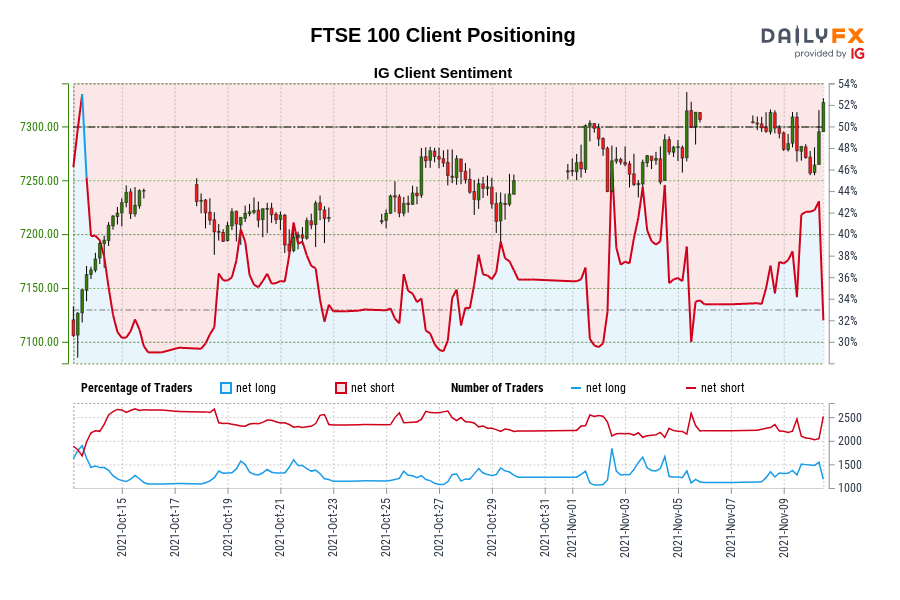
FTSE 100: Retail trader data shows 28.88% of traders are net-long with the ratio of traders short to long at 2.46 to 1. Our data shows traders are now at their least net-long FTSE 100 since Oct 16 when FTSE 100 traded near 7,240.50. The number of traders net-long is 29.24% lower than yesterday and 35.61% lower from last week, while the number of traders net-short is 25.20% higher than yesterday and 26.47% higher from last week.
We typically take a contrarian view to crowd sentiment, and the fact traders are net-short suggests FTSE 100 prices may continue to rise.
Traders are further net-short than yesterday and last week, and the combination of current sentiment and recent changes gives us a stronger FTSE 100-bullish contrarian trading bias.
element inside the
element. This is probably not what you meant to do!Load your application’s JavaScript bundle inside the element instead.
www.dailyfx.com