
Number of traders net-short has decreased by 44.51% from last week. SYMBOL TRADING BIAS NET-LONG% NET-SHORT% CHANGE IN LONGS CHANGE IN SHORTS C
Number of traders net-short has decreased by 44.51% from last week.
|
SYMBOL |
TRADING BIAS |
NET-LONG% |
NET-SHORT% |
CHANGE IN LONGS |
CHANGE IN SHORTS |
CHANGE IN OI |
|
FTSE 100 |
BEARISH |
52.47% |
47.53% |
37.52%
117.35% |
-21.27%
-44.51% |
1.50%
-8.92% |
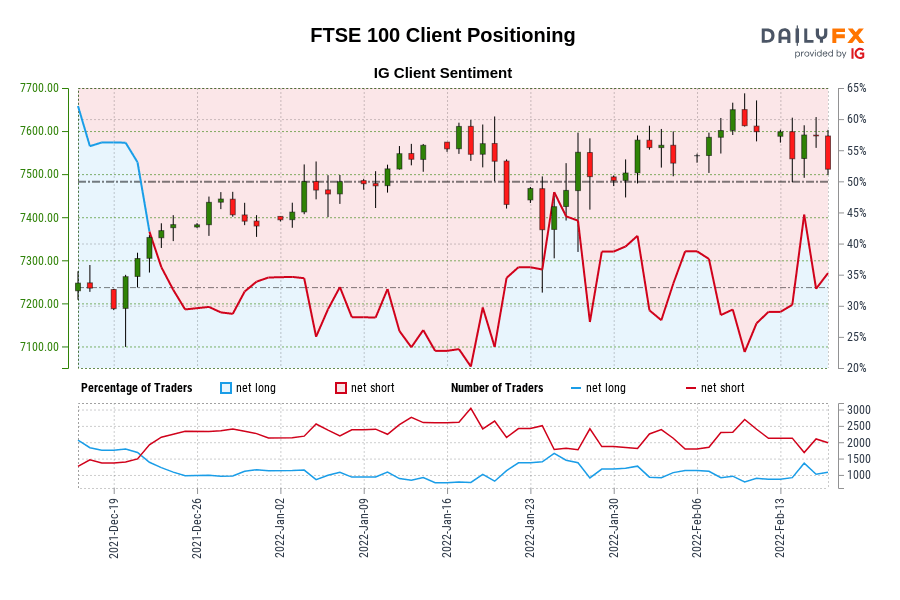
FTSE 100: Retail trader data shows 52.47% of traders are net-long with the ratio of traders long to short at 1.10 to 1. In fact, traders have remained net-long since Dec 21 when FTSE 100 traded near 7,304.20, price has moved 2.84% higher since then. The number of traders net-long is 37.52% higher than yesterday and 117.35% higher from last week, while the number of traders net-short is 21.27% lower than yesterday and 44.51% lower from last week.
We typically take a contrarian view to crowd sentiment, and the fact traders are net-long suggests FTSE 100 prices may continue to fall.
Our data shows traders are now net-long FTSE 100 for the first time since Dec 21, 2021 when FTSE 100 traded near 7,304.20. Traders are further net-long than yesterday and last week, and the combination of current sentiment and recent changes gives us a stronger FTSE 100-bearish contrarian trading bias.
element inside the
element. This is probably not what you meant to do!Load your application’s JavaScript bundle inside the element instead.
www.dailyfx.com