
Number of traders net-short has decreased by 16.86% from last week. SYMBOL TRADING BIAS NET-LONG% NET-SHORT% CHANGE IN LONGS CHANGE IN SHORTS
Number of traders net-short has decreased by 16.86% from last week.
|
SYMBOL |
TRADING BIAS |
NET-LONG% |
NET-SHORT% |
CHANGE IN LONGS |
CHANGE IN SHORTS |
CHANGE IN OI |
|
Wall Street |
BEARISH |
50.61% |
49.39% |
15.15%
12.54% |
-19.24%
-16.86% |
-4.85%
-4.19% |
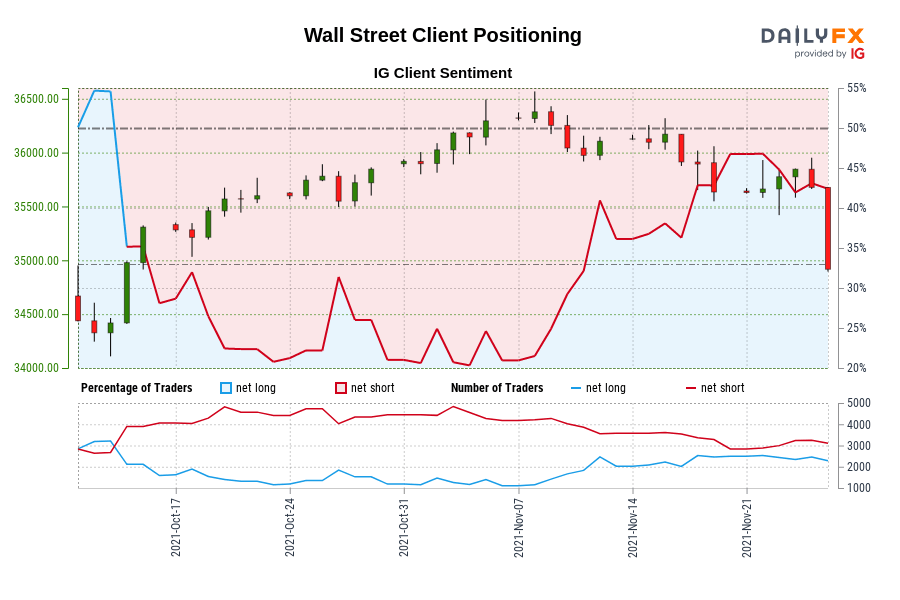
Wall Street: Retail trader data shows 50.61% of traders are net-long with the ratio of traders long to short at 1.02 to 1. In fact, traders have remained net-long since Oct 14 when Wall Street traded near 34,978.50, price has moved 0.18% lower since then. The number of traders net-long is 15.15% higher than yesterday and 12.54% higher from last week, while the number of traders net-short is 19.24% lower than yesterday and 16.86% lower from last week.
We typically take a contrarian view to crowd sentiment, and the fact traders are net-long suggests Wall Street prices may continue to fall.
Our data shows traders are now net-long Wall Street for the first time since Oct 14, 2021 when Wall Street traded near 34,978.50. Traders are further net-long than yesterday and last week, and the combination of current sentiment and recent changes gives us a stronger Wall Street-bearish contrarian trading bias.
element inside the
element. This is probably not what you meant to do!Load your application’s JavaScript bundle inside the element instead.
www.dailyfx.com