

US Dollar Basket (DXY)Talking Points:
- The greenback remains elevated ahead of tomorrow’s NFP report
- US Treasuries continue to play a dominant role in dollar moves
- Charting the path ahead: Key technical levels for DXY
A Word on Jobs Data, Treasuries and the Debt Ceiling
Yesterday’s positive ADP (private payroll) data set the tone for tomorrows NFP report as the Fed desperately looks for reasons to reign in its stimulus program. Last month’s disappointing NFP figure of only 235k forced the Fed to delay any plans of tapering despite inflation running hot. Expectations leading into tomorrow foresee 500k additional jobs created for the month of September which could just be enough to convince the Fed to communicate specifics around any upcoming tapering.
The yield on the US 10 year treasury continues to rise as investors’ and the FOMC’s interest rate expectations have recently been brought forward, with some expecting a rate hike before the end of next year. The rising treasury yield supports the bullish move seen in the US dollar.
US Treasury Bond Yield (Daily)
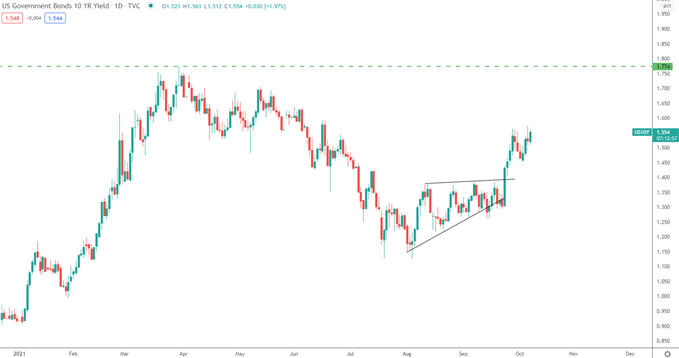

Chart prepared by Richard Snow, TradingView
In fact, according to a recent Reuters poll, US treasury yields are expected to be the biggest influencing factor when it comes to future movements in the US dollar over the next 12 months.
Reuters Poll: Major Currency Market Outlook (US Dollar)
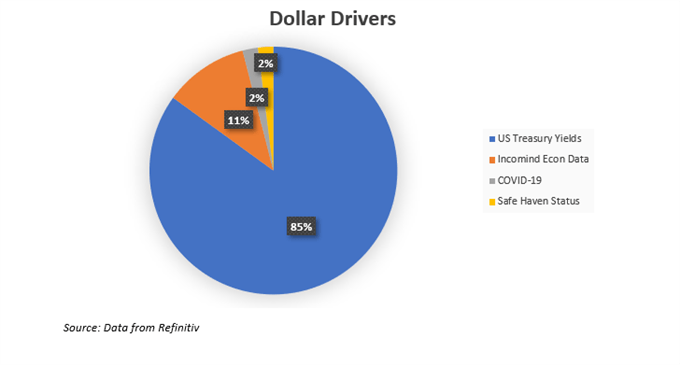

Source: Data from Refinitiv
Optimism in the air as Democrats and Republicans reached what looks like a temporary truce in the debt ceiling stand-off, however, discussions are due to continue today. US equity markets perceived the recent progress in a positive light as the S&P 500, Nasdaq 100 and Dow Jones traded higher at the open. The reduced probability of a US default once adds to existing tailwinds for the greenback.
US Dollar Elevated Ahead of NFP Data
Looking at the weekly DXY chart, it’s clear to see that the dollar weakness reversed in May this year after forming a ‘W’ pattern, as the index struggled to remain below 90 for extended periods of time. Since then, the uptrend has gained momentum and now looks to test the 9480 level which coincides with the 38.2% Fib level (measured from the 2020 high to the 2021 low).
US Dollar Basket (DXY) Weekly Chart
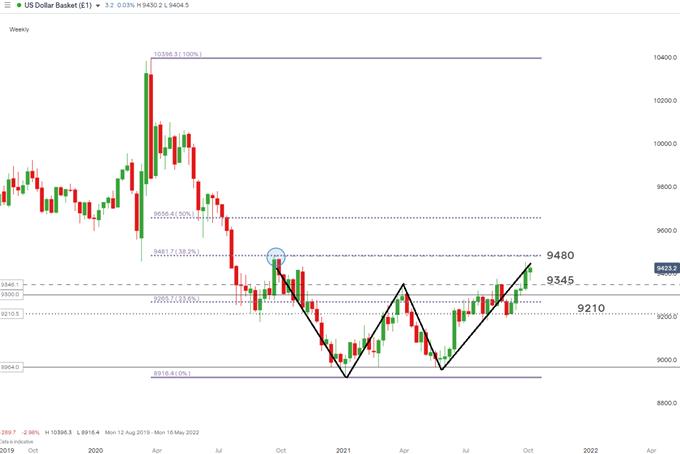

Chart prepared by Richard Snow, IG
The daily chart allows us to consider key technical levels that require closer inspection as we head into the NFP figure tomorrow.
After consolidating in the months from July to September, price action rose rather quickly off of the significant 9210 level (prior touches circled in blue) to break above 9345 and the prior high – setting the groundwork for bullish trend continuation plays. The recent pullback and advance off of the ascending trendline keeps the door open to further rising prices with the 38.3% Fib level (9480) the nearest level of resistance. However, a break below the trendline and subsequent move towards the 9345 level would bring the bullish move into question.
However, at the moment, technical and fundamentals appear bullish but do not underestimate the importance of this months NFP report as there is a significant risk of heightened volatility around the release.
US Dollar Basket (DXY) Daily Chart
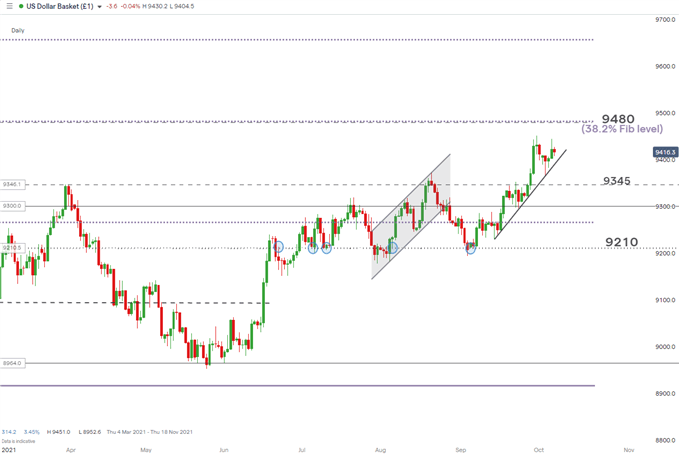

Chart prepared by Richard Snow, IG
Main Risk Event Tomorrow
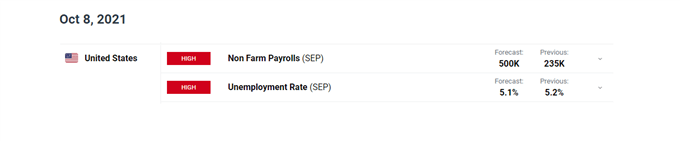

For all market-moving data releases and events see the DailyFX Economic Calendar
— Written by Richard Snow for DailyFX.com
Contact and follow Richard on Twitter: @RichardSnowFX
element inside the
element. This is probably not what you meant to do!Load your application’s JavaScript bundle inside the element instead.
www.dailyfx.com